The use of caloric restriction to slow the aging process, lengthen life and prevent medical problems.
Part II: Caloric Restriction
Every one desires to live long, but no one would be old.
- Jonathan Swift (1667-1745), Thoughts on Various Subjects, Moral and Diverting 1
To lengthen thy life, lessen thy meals.
- Benjamin Franklin, Poor Richard's Almanack, June 1733 2
Calories are a primary cause of aging, and the limiting factor in lifespan.
Key insight: cutting calories slows the aging process and prolongs life.
Aging is due to a combination of years of age and total calories eaten in your lifetime.3
The road to aging is paved with calories.
The simplest way to reduce calories is to reduce portion size: use a small plate!
By my calculations, every calorie above the absolute minimum ages your body and your mind and hastens death by about 31 seconds (+/- 10). This means that you age one day (and lose one day of life span) for every 2800 calories you eat - above a starvation diet with good nutrition (adequate protein, fats, vitamins and minerals). Carrying an extra pound of weight for one year costs 2 days of life span. In dollar terms, a candy bar might cost $20 in potential lost wages. (See “Effect of CR.XLS” for calculation details). A 40-year-old man can live 8 years longer by eating 25% less; a 15-year-old can live 16 years longer by eating 25% less. Slowing aging means MORE YOUTH, not more old age.
Turn this around: it is VERY expensive – in terms of money, aging, disability and early death – to keep your weight up!
Can you afford to stay plump?
Last updated 2007-01-09
See the photo at http://sciencenews.org/20020511/fob2.asp
Figure 5: Calorie restricted dogs live longer and better
These Labrador Retriever dogs are littermates in a study sponsored by Purina.7 The 25% caloric restricted dog is on the left. The CR dogs had a much lower rate of osteoarthritis. To see a video of elderly rats, where the few living AL rats move slowly, while the CR rats romp around, go to http://www.biomarkerinc.com/html/press.htm.
I collect these notes for myself, to keep references for various facts or speculations that are health-related. This is NOT medical advice. Some of these things are likely to prove useless or even harmful with time.
The following spreadsheet allows you to calculate the effect of CR for yourself. You must have Microsoft Excel installed to modify it (double click on the sheet):
First statement: everyone should clearly understand that caloric restriction (CR) is the most important way to reduce or delay the incidence of virtually ALL of the problems of aging, from mental decline to heart disease to cancer and even to death itself. For prevention, CR works far better than medicine, far better than fruit and vegetables, far better than reducing cholesterol (which CR itself does better than any medicine that I know of) – in short the effects of CR are amazing. Severe CR is not yet proven to prolong maximum life-span in humans to the dramatic amounts seen in all lab animals; however it dramatically reduces both disease rates and risk factors and has been proven repeatedly to be remarkably effective in prolonging life span for animals of all types. In short, CR is the only intervention proven to slow the aging process itself. If you do nothing else for your health, practice CR to some extent.
Caveat: moderate CR (tends to lead to a BMI of about 17) or substantial CR (tends to lead to a BMI of about 15) is potentially dangerous for some and should be taken on slowly, carefully, and with optimal nutrition. The effects of CR on young children, pregnant women, and those with specific medical conditions are not known to me; I do NOT recommend moderate or severe CR for these people. Even so, there is good evidence that the opposite (being overweight or obese) is outright harmful for these groups.
Caloric restriction has been demonstrated to have the following benefits (some from animal studies, some from evidence in humans), all documented.
Substantially longer lifespan
Lesser incidence and later onset of certain diseases (in essence, all the diseases of aging). [Note: in the italicized relative risks quoted below, this number is from a particular study of select groups of people. The value of this number can be misleading; MUCH better would be an all-cause mortality and morbidity life span study; this however is difficult, expensive and time-consuming.]
Vascular:
Cancer (most)
Prostate
Colon
Breast
Uterus
Endometrium
Kidney
Esophagus
Pancreas
Gallbladder
Liver
Stomach (top section)
Diabetes (adult onset, type II) – 8 to 12 times more common in obese people4
Neurologic & sensory:
Alzheimer’s disease - For every unit increase in BMI at age 70 years, [Alzheimer’s Disease] risk increased by 36%.6
Stroke – Twice as common in obese people7
Loss of brain tissue with age – ~13% per unit increase in BMI8
Multiple sclerosis – an increased risk of 5% for each unit increase in BMI9
Cataract
Macula degeneration
Loss of retina ganglion cells
Hearing loss
Degenerative
Arthritis (osteoarthritis and rheumatoid arthritis)
Hip fracture
Muscle degeneration of aging (sarcopenia)
Knee replacement – 6 to 11 times more common in obese people4
Atopic dermatitis
Asthma
Benign prostate hypertrophy
Endometriosis & polycystic ovary syndrome
Preeclampsia – 6 times more common at a pre-pregnancy BMI of 30 than BMI of 1710
Gallstones
Pancreatitis – 1.9 times more common in obese people4
Kidney damage
Skin aging
Heartburn – directly related to BMI, and up to 4 times more common in obese women11
Accidents
injury in auto accidents
dying from injuries
breaking bones in children12
Chronic fatigue – 3.6 times more common in obese people4
Insomnia – 3.5 times more common in obese people4
Psychiatric diseases, including major depression, panic disorder and bipolar disorder – 21-47% more common in obese people13
Preservation of mental function
Preservation of ovarian function
Less hot flashes in menopausal women – twice as many in obese women than in those of normal BMI14
Better markers of aging, including lab values (HDL/LDL, cholesterol, triglycerides, lipids, HgA1C, and CRP), DNA damage, AGE formation and accumulation
Less disability, even in the last years of life (and when it occurs, it does so later than in obese people!)
Less inflammation, less atopy – 3 times more specific IgE in obese people15
Fewer operating room errors when doing surgery on thin people
Better immune function
Greater attractiveness (thin people look better, are more active and appear younger; see graph below)
The evidence that CR works comes from many sources: animal and human, both direct and indirect evidence. The tables below summarize this evidence. There are a few studies that find problems or no benefit to CR in certain parameters; most studies find a strong benefit to CR. Note: I have sometimes excluded studies that purport to show a positive or negative effect of CR purely based on a lab finding (DNA, blood cell count, etc.) that I think is not good evidence one way or another.
Animal studies: evidence for and benefits of caloric restriction
|
Category |
Animal |
Finding |
Ref |
Fig |
|
Lifespan |
Rodents |
The first study to show that CR prolongs life |
|
|
|
|
|
“Because diet restriction is so effective as an anti-ageing intervention, a reputable study should include a way to detect and prevent inadvertent diet restriction by the animal subjects" |
|
|
|
|
|
It is not thinness but reduced food intake that slows aging in rodents. “Calories, calories, calories”. |
|
|
|
|
Dogs |
25% CR => 15% longer life “Median life span …was 11.2 years for the control group versus 13 years for the lean-fed dogs.” Lower rate and much later onset of osteoarthritis |
|
|
|
|
|
Small dogs live longer than large dogs: Papillons (3.0 kg) live 14 yr; Great Danes (63 kg) live 8.5 yr on average. By my calculations (using the “Effect of CR.XLS” spreadsheet) this can be ENTIRELY explained by differences in calorie intake. Ditto for Labrador Retrievers (30 kg, 12 yr) |
|
|
|
|
Cows |
|
|
|
|
|
Rhesus monkeys |
National Institutes on Aging studies. Current death rates in the CR groups are about ½ that in the ad lib diet group |
|
|
|
|
|
Johns Hopkins study of “117 laboratory-maintained rhesus monkeys studied over approximately 25 years (8 dietary-restricted [DR] and 109 ad libitum-fed [AL] monkeys)…There was significant organ pathology in the AL at death. The age at median survival in the AL was approximately 25 years compared with 32 years in the DR…These results suggest that dietary restriction leads to an increased average age of death in primates, associated with the prevention of hyperinsulinemia and the mitigation of age-related disease.” |
|
|
|
|
Mice |
CR works even when started in middle age: “The [26% reduced calorie diet] lowered body weight by 26% and increased maximum life span by ~15%.” |
|
|
|
|
|
“CR initiated in 19-month-old mice begins within 2 months to increase the mean time to death by 42% and increase mean and maximum lifespans by 4.7 (P = 0.000017) and 6.0 months (P = 0.000056), respectively.” |
|
|
|
|
|
Small strains of mice live 30 days longer than large strains; the small ones eat less (presumably) making this study a proxy for CR. |
|
|
|
|
|
“The [middle-age onset CR] mice on the restricted diet averaged 10 to 20 percent increases in mean and maximum survival times compared to the control mice. Spontaneous lymphoma was inhibited by the food restriction” |
|
|
|
|
|
From Science News , May 1 2004, p. 277. Yoda, a mouse that carried a mutation that disables production of three hormones required for normal growth, died at age 4 yr and 12 days. Normal lifespan for the non-mutated mice of this strain is 2 to 2.5 yr, and the normal weight is 30-35 gm. Yoda's diet was ad lib, and his weight varied between 10 and 15 gm.
Now, assuming that his metabolic rate was unchanged by the mutation, then he would have eaten 38% of the amount of food as his non-mutant cohorts. This is analogous to 62% "caloric restriction". This amount of caloric restriction - by calculations I did based on the Merry et al graph - should extend his expected lifespan to 3.4 yr. Thus most of his extended life span could be explained by the smaller amount of food he ate to support his smaller body; I suspect that much of the additional 7 months is from the natural variance in lifespan. |
|
|
|
|
Rats |
CR works best when done all of your life, but is equally effective at prolonging lifespan when started either in childhood or adulthood. Rats restricted from 30 days of age and switched to AL at 12 months and rats fed AL until 12 months of age and then switched to CR had similar mean and maximum lifespans. Their mean and maximum lifespans were shorter than those of the always restricted rats but longer than those of the AL group. Here are the exact numbers (from Table 5, p. 17): Group Mean LS (weeks) Maximum LS* (weeks) Ad libitum 133.1 +/- 4.1 169.4 +/- 1.9 Restricted 163.4 +/- 3.9 200.1 +/- 3.1 Ad lib/restricted 150.0 +/- 4.6 178.6 +/- 1.5 Restricted/ad lib 149.2 +/- 3.6 182.6 +/- 2.1 *Mean survival time for the longest lived 10% of each population.
Maximum LS (estimated from survival curves, p. 16): AL 180 weeks R 220 weeks AL/R 190 weeks R/AL 190 weeks |
|
|
|
|
|
“The reductions in [body weight] appeared to account for approximately 11% of the effect of CR. CONCLUSION: CR and [body weight] have independent effects on [morality rate] in Wistar rats. [body weight] may mediate a small part of the CR effects on [morality rate].” |
|
|
|
|
Mollusks |
"Fischer-Piette (1939) reported that when food is abundant, the mollusc, Patella vulgata only lives 2.5 years, whereas in waters poor in organic material its survival may reach 16 years." |
|
|
|
|
Fruit flies |
For Drosophila, “caloric intake is reduced on all diets that extend life span.” |
|
|
|
|
Grasshoppers |
“grasshoppers… on CR (60 or 70% of ad libitum) or late-onset CR had at least 60% greater longevity than ad libitum individuals.” |
|
|
|
|
Various |
CR works on nearly all studied animals |
|
|
|
Heart disease |
Rats33 |
“These results clearly indicate that even low [CR] levels were effective in preventing or slowing the progression of these [heart and kidney] diseases.” In table form: Diet Ad lib 10% CR CR 25% CR 40%
Incidence heart trouble 95% 75% 45% 15%
Incidence kidney trouble 55% 20% 15% 0%
|
|
|
|
|
|
CR prevents the usual age-related decrease in cardiac & skeletal mitochondria function. “In skeletal muscles and heart in vitro complex IV activity is lower in young adult caloric restricted (CR) animals despite normal aerobic function in situ and in vivo. On the other hand, whereas markers of oxidative capacity decline 25% to 46% between 8 and 10 months and 35 months in ad libitum fed (AL) animals, in most muscles there is no decline in CR across the same absolute age (35 mo old) or relative age (35% survival rate) span and PGC-1alpha gene expression in gastrocnemius muscle declines more slowly with aging. The present results show that CR largely prevents the age-associated decline in mitochondrial function in heart and skeletal muscles, and suggest that this is secondary to a better-maintained drive on mitochondrial biogenesis.” |
|
|
|
Cancer |
Mice |
“Relative to the AL group, CR significantly delayed (P = 0.001) the onset of tumors in adult mice” “CR … suppressed carcinogenesis-even when started late in life in mice predestined to develop tumors” |
|
|
|
|
|
“Our observations are consistent with the hypothesis that energy restriction reduces prostate tumor growth by inhibiting tumor angiogenesis. Furthermore, dietary fat concentration does not influence prostate tumor growth when energy intake is reduced.” |
|
|
|
|
|
In a large, careful analysis showed that CR protects against breast cancer: “…energy-restricted animal groups developed 55% less mammary tumors than the control groups. …energy restriction in itself consistently protects against the development of mammary tumor in mice, irrespective of the type of restricted nutrient or other study characteristics.” |
|
|
|
|
Rats |
“Caloric restriction (although with concomitant intake of more fat) led to complete inhibition of tumor formation. These results indicate that both high-fat and high-calorie diets exhibit [co-carcinogenic], not merely promotional, properties. Caloric intake may be a greater determinant than dietary fat of a tumor-enhancing regimen. Finally, restriction of caloric intake during promotion markedly suppresses tumor formation, despite the increased fat content of the restricted diet” |
|
|
|
Advanced glycation endproducts (AGEs) |
Rats |
The most important factor to prevent damage to the body’s proteins from glucose is caloric restriction. “…age-related accumulation of AGE is more closely related to caloric intake.” |
|
|
|
|
Monkeys |
CR reduced AGEs |
|
|
|
Diabetes |
Rhesus monkeys |
An on-going NIH-sponsored study of CR in monkeys, the markers of aging all point to the same thing happening in primates. This study has been going on since 1987, and has already demonstrated that CR completely prevents diabetes type II in these animals. |
|
|
|
|
Dogs |
“Glucose disposal efficiency and insulin response were associated with increased quality and length of life in diet-restricted dogs.” (Labrador retrievers) |
|
|
|
DNA damage |
Reduced with CR |
Reduced DNA damage (both mitochondrial and nuclear), (Proceeds of the National Academy of Science, 2002-10-28 Prolla and Weindrich state that their DNA study of calorie-restricted mice “provides compelling evidence that -- even starting in middle age -- cutting calories can confer significant health benefits for the heart and extend its working life.”) |
|
|
|
|
|
CR reduces both mitochondria DNA damage and nuclear DNA damage. |
|
|
|
Inflammation |
Reduced with CR |
“Based on available finding and our recent supporting evidence, … It was further proposed that CR's major force of the regulation of redox-sensitive inflammation may well be its life-prolonging action.” |
|
|
|
Mental and brain function |
|
“Life-long food restriction led to small but significant improvements in performance in the water maze in aged rats.” |
|
|
|
|
Rats |
“Food-restricted rats learned the food maze more quickly than did free-feeding rats. … Food-restricted rats also learned the water maze more quickly than the food maze and learned both mazes faster than free-feeding rats.” |
|
|
|
|
|
“in aged rats, not only was learning slowed down, but memory utilization was also impaired. These cognitive deficiencies were absent in rats fed the hypocaloric diet.” |
|
|
|
|
|
“It has recently been shown that reduced calorie intake can increase the resistance of neurons in the brain to dysfunction and death in experimental models of Alzheimer’s disease, Parkinson’s disease, Huntington’s disease and stroke.” and “…there is now irrefutable evidence for the central role of mitochondria in both normal (physiological) aging and neurodegenerative diseases [including the 'big three' - Alzheimer's, Parkinson's and Huntington's diseases].” |
|
|
|
|
|
A video showing very active CR rats contrasted with slow, old-appearing AL rats on the Intranet |
|
|
|
|
|
CR protects rats’ brains from chemical damage. |
|
See the web site |
|
|
|
“The results suggest that life-long food restriction retards motoneuronal cell death occurring with advancing age.” |
|
|
|
|
|
“…calorie restriction preserves nervous-system functions…” |
|
|
|
|
|
“…in different experimental models neurodegeneration can be differentially rescued by dietary restriction.” |
|
|
|
|
|
"CR substantially decreased the accumulation of Amyloid beta-plaques in both lines: by 40% in [one mutation] (CR, 6 weeks), and by 55% in A[the other] (CR, 14 weeks)… CR also decreased astrocytic activation (GFAP immunoreactivity) [an inflammatory response again associated with -- and again widely believed to play a pathological role in AD]… These influences of CR on AD-transgenic mice are consistent with epidemiological reports that show that high caloric diets associate with the risk of AD [Alzheimer’s Disease], and suggest that dietary interventions in adult life might slow disease progression." |
|
|
|
|
Mice |
“…the risk of [Alzheimer disease] and [Parkinson disease] may be increased in individuals with high-calorie diets and in those with increased homocysteine levels. Dietary restriction and supplementation with folic acid can reduce neuronal damage and improve behavioral outcome in mouse models of [Alzheimer disease] and [Parkinson disease].” |
|
|
|
|
|
Mid-life reduction in calories by about 40% => “increased longevity and preserved strength, coordination, and spontaneous alternation behavior” |
|
|
|
|
|
“CR substantially decreased the accumulation of Amyloid beta-plaques in both lines: by 40% in [one mutation] (CR, 6 weeks), and by 55% in A[the other] (CR, 14 weeks)…CR also decreased astrocytic activation (GFAP immunoreactivity)… an inflammatory response again associated with … and again widely believed to play a pathological role in … AD… These influences of CR on AD-transgenic mice are consistent with epidemiological reports that show that high caloric diets associate with the risk of AD, and suggest that dietary interventions in adult life might slow disease progression." |
|
|
|
|
|
“We report that a CR dietary regimen prevents Abeta peptides generation and neuritic plaque deposition in the brain of a mouse model of AD neuropathology … support existing epidemiological evidence indicating that caloric intake may influence risk for AD [Alzheimer’s Disease] and raises the possibility that CR may be used in preventative measures aimed at delaying the onset of AD amyloid neuropathology.” |
|
|
|
|
Monkeys |
“the anti-Parkinson's disease effect of the low-calorie diet.” |
|
|
|
|
Red squirrels |
“Recent studies from our laboratories and others suggest that calorie restriction (CR) may benefit Alzheimer's disease (AD) by preventing amyloid-beta (Abeta) neuropathology in the mouse models of AD….We found that 30% CR resulted in reduced contents of Abeta_{1-40} and Abeta_{1-42} peptides in the temporal cortex of Squirrel monkeys, relative to control (CON) fed monkeys.” |
|
|
|
Hearing |
Rats |
“Results indicated that the 30%-caloric-restricted group maintained the most acute auditory sensitivities, the lowest quantity of mtDNA deletions, and the least amount of outer hair cell loss.” |
|
|
|
|
Rhesus monkeys |
So far, in the Wisconsin CR study, there is no benefit. “We found no significant effects of CR on any auditory parameters examined.” |
|
|
|
|
Mammals |
“Calorie restriction…has been shown to attenuate [age-related hearing loss] and age-related cochlear degeneration and to lower quantity of mtDNA deletions in the cochlea of mammals.” |
|
|
|
Toxin |
Rats |
“AL rats experienced 90% mortality while all of the DR rats, with the same amount of initial bioactivation-mediated liver injury, survived.” |
|
|
|
Aging |
Mice |
"On one side, the calorie-restricted mice are jumping, and running around, and looking young," says Stephen Spindler, a biochemist who does such experiments at the University of California-Riverside. "On the other side, the litter mates look old. They're gray, and they have more balding. They move less. It makes me want to go on a diet." |
|
|
|
Lens |
Mice |
“A significantly reduced proliferative capacity of LE cells is associated with increased age of mice and is delayed by long-term caloric restriction as measured in vitro and in vivo.” |
|
|
|
Muscle |
Rhesus monkeys |
Sarcopenia (degenerative muscle loss caused by aging processes) is greatly reduced by CR. “…caloric restriction (CR) retards several age-dependent physiological and biochemical changes in skeletal muscle, including increased steady-state levels of oxidative damage to lipids, DNA, and proteins… Caloric restriction of rhesus monkeys lowers oxidative damage in skeletal muscle.” |
|
|
|
|
Rats |
“CR begun in late middle age can retard age-associated fiber loss and fiber-type changes as well as lower the number of skeletal muscle fibers exhibiting mitochondrial enzyme abnormalities. CR can also decrease the accumulation of deleted mitochondrial genomes.” |
|
|
|
|
|
“…this study shows a loss of muscle function with age, and suggests that long-term calorie restriction is an effective intervention against the loss of muscle function with age.” |
|
|
|
|
|
“Calorie restriction prevented [muscle] fiber loss with age” |
|
|
|
|
|
CR => less decline in muscle with age |
|
|
|
|
|
“The effect of mild lifelong dietary restriction (DR) on age-related changes was investigated in rats... DR-fed rats retained motor activity even in old age compared with ad libitum-fed rats. The [histological study] results suggest that even mild calorie restriction is enough to attenuate oxidative stress and age-related morphological changes in skeletal muscle.” |
|
|
|
|
|
“We evaluated the hypothesis that long-term caloric restriction and exercise would have beneficial effects on muscle bioenergetics and performance in the rat. By themselves, each of these interventions is known to increase longevity…The combination of caloric restriction and exercise resulted in a significant attenuation in the decline in developed force during the second period of stimulation (P < 0.05)…Our experiments thus demonstrated a synergistic effect of long-term caloric restriction and free exercise on muscle bioenergetics during electrical stimulation.” |
|
|
|
Heart |
Various |
An editorial summarizing the evidence states that “Caloric restriction has specific effects on the heart; it decreases the occurrence and severity of spontaneous age-related cardiomyopathy in rats, it improves diastolic function in old mice, it modifies the pattern of gene expression in the mouse heart, and it increases IGF-1 receptor density in the rat heart.” |
|
|
|
Eye |
Rats |
Retina ganglion cells tend to die off with age. Moderate CR prevents about 25% of this loss. |
|
|
|
|
|
“Caloric restriction in old animals is neuroprotective against damage in the retina following ischemia” |
|
|
|
|
|
“Dietary caloric restriction (CR) is the only experimental intervention that can reliably retard the development of cataract in a normal animal model… These data are the first to suggest that CR may retard the age-related degeneration of the lens by attenuating the oxidative stress in the lens. Since oxidative stress is likely a main cause of human cataract, CR intervention may be relevant to humans as well.” |
|
|
|
Immune system |
|
“Overall, the immunological status of rodents fed a restricted diet is superior to the immunological status of the non-restricted animals.” |
|
|
|
Reproductive System |
Monkeys |
Preservation of ovarian function Reduced incidence of endometriosis |
|
|
|
Skin aging |
Rats |
In short, CR reduces aging of the skin. CR will make you LOOK younger, as well as feel younger and live longer. “Histomorphological changes resulting from intrinsic aging affected some of the studied variables in the rat skin, and these changes were delayed or prevented by CR.” |
|
Human studies: evidence for and benefits of caloric restriction
|
Category |
Summary |
Finding |
Ref |
Fig |
|
Lifespan |
Small people live longer |
“Shorter stature and smaller body weight appear to promote better health and longevity in the absence of malnutrition and infectious diseases” |
Figure 5 |
|
|
|
|
“Various studies indicate a loss of 0.47 year of longevity for each cm increment of height.” |
|
|
|
|
|
“Men of height 175.3 cm or less lived an average of 4.95 years longer than those of height over 175.3 cm, while men of height 170.2 cm or less lived 7.46 years longer than those of at least 182.9 cm. An analysis by weight difference revealed a 7.72-year greater longevity for men of weight 63.6 kg or less compared with those of 90.9 kg or more.” |
|
|
|
|
|
Small (both in height and weight) people live longer than large people - this may be why women live longer than men. |
|
|
|
|
|
“The authors urge medical and scientific professionals to consider the many advantages of shorter stature in terms of health, social and environmental benefits.” |
|
|
|
|
|
A nice, free summary of the data that smaller people live longer than taller people, and (within species) that smaller animals live longer too. |
|
|
|
|
|
A meta-analysis of human studies. “Findings show absolute body size is negatively related to longevity and life expectancy and positively to mortality. Trend lines show an average age at death versus weight slope of -0.4 years/kg.” “…both excess lean body mass and fat mass may promote chronic disease.” 1. My calculations: the results of this study are consistent with a “cost per calorie” of about 20 seconds. This is less than the ~40 seconds per calorie predicted by mouse studies, but the human studies are not controlled. My guess based on calculations: 31 seconds per calorie for humans 2. n.b. this effect seemed to be body SIZE dependent, so that a tall person who was thin (at say 180#) would have a lower life expectancy than a short medium-build (150#) person. But whether this is based on actual weight or on calorie intake was not clearly differentiated IMO. For the individual (you and me) the lesson is clear: we cannot grow shorter, so lose weight. |
|
|
|
|
|
“Severe dietary restriction delays the physical development of rodents and leads to adult animals of reduced body size but significantly increased life expectancy…We calculated the mean height of young men liable to the military service around 1860 and determined their longevity retrospectively using posterior census data. This was done separately for all the Spanish provinces. The linear regression between both parameters manifests a statistically highly significant relationship: the smaller the mean height at age 18 in a province, the higher the chance for people living there to reach high chronological ages.” |
|
|
|
|
Eating less => longer life |
Okinawans typically eat 10-40% less calories for a given body frame than Americans because of a cultural practice called “hara hachi bu”, or eating until 80% full. They have a longer lifespan (81 yr vs. 77 yr for Americans) In 1990, the number of centenarians per 100,000 population: US = 15 Japan = 22 Okinawa = 134 (Okinawans typically ate 1% less than other Japanese) |
|
|
|
|
|
“… The most important conclusion is that a person can get a better appreciation of the importance of avoiding excess caloric intake if human age is measured in terms of lifetime caloric intake.” |
|
|
|
|
|
“For those who have the desire and self-discipline to adhere to such a lifestyle [caloric restriction, low fat, vegan-type diet], the prospects for staying lean, smart, spry, and healthy into a very ripe old age may be better than most would suspect." |
|
|
|
|
|
“Comparisons of diets and disease rates between Adventists and non-Adventists, and prospective cohort studies among Adventists, have contributed greatly to our general understanding of nutrition and health. The most fundamental conclusion drawn from the Adventist Health Studies has been that maintaining a lean body weight throughout life is central for optimal health.”
“Commonly observed combinations of diet, exercise, body mass index, past smoking habits… can account for differences of up to 10 years of life expectancy among Adventists.” |
|
|
|
|
|
A study supposedly debunking CR points out that an average Japanese man has a lifespan of 77 yr; an average sumo wrestler has a lifespan of 56 yr. They quote an estimated food intake of 2300 and 5500 calories/day, respectively. If this is a lifetime intake average, and if they are correct, then CR does not work as well in men as the animal models suggest – but it does work! |
|
|
|
|
Lower BMI => low mortality |
A study of middle age women: mortality is lowest in those with BMI < 19. “Lean women did not have excess mortality. The lowest mortality rate was observed among women who weighed at least 15 percent less than the U.S. average for women of similar age” |
|
|
|
|
|
“The relative risks among the heaviest individuals for overall death, death caused by coronary heart disease (CHD), and death caused by cardiovascular disease (CVD) are 1.22, 1.57, and 1.48, respectively, when compared with the those within the lowest BMI category.” |
|
|
|
|
|
“Current evidence supports the notion that the body mass index associated with the lowest mortality falls within the range of 18.5 to 24.9 in men and women between the ages of 30 and 74.” |
|
|
|
|
|
A study of Adventist men that controlled for confounding factors showed that “a positive, linear relation between BMI and all-cause mortality,” (i.e., the fat people died faster). |
|
|
|
|
|
A 5-year study of 85,078 physician men found that “among men who never smoked a linear relation [greater BMI=> increased mortality] was observed with no increase in mortality among leaner men (P for trend, <0.001). Among never smokers, in multivariate analyses adjusted for age, alcohol intake, and physical activity, the relative risks of all-cause mortality increased in a stepwise fashion with increasing BMI. Excluding the first 2 years of follow-up further strengthened the association (multivariate relative risks, from BMI<20 to 30 kg/m(2), were 0.93, 1.00, 1.00, 1.16, 1.45, and 1.71 [P for trend, <0.001]). In all age strata (40-54, 55-69, and 70-84 years), never smokers with BMIs of 30 or greater had approximately a 70% increased risk of death compared with the referent group (BMI 22.5-24.9). Higher levels of BMI were also strongly related to increased risk of cardiovascular mortality, regardless of physical activity level (P for trend, <0.01). CONCLUSIONS: All-cause and cardiovascular mortality was directly related to BMI among middle-aged and elderly men. Advancing age did not attenuate the increased risk of death associated with obesity. Lean men (BMI<20) did not have excess mortality, regardless of age.” |
|
|
|
|
|
Being overweight (BMI > 25 and < 30) or obese (BMI > 30) in middle age have recently been demonstrated to have an independent adverse effect on life span in the very large and long-term Framingham study. “Forty-year-old female nonsmokers lost 3.3 years and 40-year-old male nonsmokers lost 3.1 years of life expectancy because of overweight. Forty-year-old female nonsmokers lost 7.1 years and 40-year-old male nonsmokers lost 5.8 years because of obesity.” This decrement in lifespan is actually less than that predicted from induction from the caloric restriction studies in rodents. By my own calculations from the rodent model (40 seconds per calorie), being overweight starting at age 40 should result in a decrement of 6 yr of life, while being obese starting at age 40 should result in a decrement of 15 yr (approximately). |
|
|
|
|
|
A chart of weight percentiles vs. age is interesting to me: the 95th percentile drops dramatically after age 50 yr.: I think this is because obese people die young. |
|
|
|
|
|
“Participants were 17,643 men and women aged 31 through 64 years, recruited from Chicago-area companies or organizations and free of coronary heart disease (CHD), diabetes, or major electrocardiographic abnormalities at baseline. MAIN OUTCOME MEASURES: Hospitalization and mortality from CHD, cardiovascular disease, or diabetes, beginning at age 65 years. RESULTS: In multivariable analyses that included adjustment for systolic blood pressure and total cholesterol level, the odds ratio (95% confidence interval) for CHD death for obese participants compared with those of normal weight in the same risk category was 1.43 (0.33-6.25) for low risk and 2.07 (1.29-3.31) for moderate risk; for CHD hospitalization, the corresponding results were 4.25 (1.57-11.5) for low risk and 2.04 (1.29-3.24) for moderate risk. Results were similar for other risk groups and for cardiovascular disease, but stronger for diabetes (eg, low risk: 11.0 [2.21-54.5] for mortality and 7.84 [3.95-15.6] for hospitalization). CONCLUSION: For individuals with no cardiovascular risk factors as well as for those with 1 or more risk factors, those who are obese in middle age have a higher risk of hospitalization and mortality from CHD, cardiovascular disease, and diabetes in older age than those who are normal weight.” |
|
|
|
|
|
Even adolescents and young adults should be thin. Being overweight raises your risk of premature death by 66%; obesity nearly triples your risk: “OBJECTIVE: To examine the relation between adiposity in adolescence and premature death in women. DESIGN: Prospective cohort study… PARTICIPANTS: 102,400 women from the Nurses' Health Study II who were 24 to 44 years of age... MEASUREMENTS: In 1989, current weight and height and recalled weight at age 18 years were assessed by using validated questionnaires, and body mass index (BMI) was calculated. Hazard ratios for death and 95% CIs were adjusted for potential confounders, including cigarette smoking, alcohol use, and physical activity during adolescence. RESULTS: During 12 years of follow-up, 710 participants died. Compared with a BMI of 18.5 to 21.9 kg/m2 at age 18 years, the hazard ratio for premature death was … 1.18 … for a BMI of 22.0 to 24.9 kg/m2, 1.66 …for a BMI of 25.0 to 29.9 kg/m2, and 2.79 … for a BMI of 30 kg/m2 or greater. Among participants who never smoked, a BMI of 22.0 to 24.9 kg/m2 at age 18 years was also associated with increased premature death (hazard ratio, 1.50 …CONCLUSION: Moderately higher adiposity at age 18 years is associated with increased premature death in younger and middle-aged U.S. women.” |
|
|
|
|
|
“Prospective cohort study within the Honolulu Heart Program/Honolulu Asia Aging Study. A total of 5820 Japanese American middle-aged men (mean age, 54 [range, 45-68] years) free of morbidity and functional impairments were followed for up to 40 years (1965-2005) to assess overall and exceptional survival. Exceptional survival was defined as survival to a specified age (75, 80, 85, or 90 years) without incidence of 6 major chronic diseases and without physical and cognitive impairment. MAIN OUTCOME MEASURE: Overall survival and exceptional survival. RESULTS: Of 5820 original participants, 2451 participants (42%) survived to age 85 years and 655 participants (11%) met the criteria for exceptional survival to age 85 years. High grip strength and avoidance of overweight, hyperglycemia, hypertension, smoking, and excessive alcohol consumption were associated with both overall and exceptional survival. In addition, high education and avoidance of hypertriglyceridemia were associated with exceptional survival, and lack of a marital partner was associated with mortality before age 85 years. Risk factor models based on cumulative risk factors (survival risk score) suggest that the probability of survival to oldest age is as high as 69% with no risk factors and as low as 22% with 6 or more risk factors. The probability of exceptional survival to age 85 years was 55% with no risk factors but decreased to 9% with 6 or more risk factors.” |
|
|
|
|
Weight loss by adults => lesser mortality risk |
“6391 overweight and obese persons (body mass index > or = 25 kg/m2) who were at least 35 years of age… followed for 9 years. Hazard rate ratios (HRRs) were adjusted for age, sex, ethnicity, education, smoking, health status, health care utilization, and initial body mass index. … those reporting intentional weight loss had a 24% lower mortality rate (HRR, 0.76 [95% CI, 0.60 to 0.97]).” (note: just trying to lose weight, even if unsuccessful, also led to a somewhat lower mortality rate). |
|
|
|
|
Lower weight at age 21 => longevity |
“a higher weight at age 21 was associated with increased odds of dying before age 90 (OR=1.04 per 5 lb increase, p < 0.0001)… Low weight during early adulthood as well as physical exercise well into adulthood are related to an increased chance of survival to age 90.” |
|
|
|
|
Ageing accelerated in the obese |
“This report will focus on the potential cause-effect relationship between increased fat mass and accelerated ageing. In humans, increased fat mass (obesity), and in particular increases in abdominal obesity as a result of deposition of visceral fat, are associated with the metabolic syndrome of ageing.” |
|
|
|
Can people be too thin? |
Down to a very low BMI, No! |
If you simply look at a table of life expectancy vs. obesity, it appears that there is a decrease for both obesity and excessive thinness. This has led to the false thought that it is harmful to be "too thin". In fact, the thin people included in these charts are often smokers or those with chronic disease.
From a 1987 careful literature methods review in JAMA, “Conflicting results have been reported concerning the association between body weight and longevity. The shape of the curve relating weight to all-cause mortality has been variously described as linear, J-shaped, and even U-shaped. To assess the validity of the evidence for optimal weight recommendations, we examined the 25 major prospective studies on the subject. Each study had at least one of three major biases: failure to control for cigarette smoking, inappropriate control of biologic effects of obesity, such as hypertension and hyperglycemia, and failure to control for weight loss due to subclinical disease. The presence of these biases leads to a systematic underestimate of the impact of obesity on premature mortality. Although these biases preclude a valid assessment of optimal weight from existing data, available evidence suggests that minimum mortality occurs at relative weights at least 10% below the US average.” [Note: this was 10% below the 1987 average, which was significantly below the current average BMI] |
|
|
|
|
|
Available well-researched and well-analyzed epidemiology shows that mortality (among nonsmokers without preexisting medical conditions) is lowest in people with the lowest BMI. |
|
|
|
|
|
A large, 5 year FU study found: “We analyzed the association between body mass index (BMI) and both all-cause and cause-specific mortality among 85,078 men aged 40 to 84 years from the Physicians' Health Study enrollment cohort. … Among never smokers, in multivariate analyses adjusted for age, alcohol intake, and physical activity, the relative risks of all-cause mortality increased in a stepwise fashion with increasing BMI… Higher levels of BMI were also strongly related to increased risk of cardiovascular mortality, regardless of physical activity level (P for trend, <0.01). CONCLUSIONS: All-cause and cardiovascular mortality was directly related to BMI among middle-aged and elderly men. Advancing age did not attenuate the increased risk of death associated with obesity. Lean men (BMI<20) did not have excess mortality, regardless of age.” |
|
|
|
|
|
“Average-adulthood BMI appears to be an appropriate predictor of mortality risk…. Among non-elderly persons, being leaner meant a lower mortality risk, down to the lowest category of leanness in the study-<20 kg/m” |
|
|
|
|
|
“The re-analysis confirms the findings of a positive, linear relation between BMI and all-cause mortality, reported in the original study.” |
|
|
|
|
|
“In a 12-year prospective study, the authors examined the relation between body mass index (BMI) and mortality among the 20,346 middle-aged (25-54 years) and older (55-84 years) non-Hispanic white cohort members of the Adventist Health Study (California, 1976-1988) who had never smoked cigarettes and had no history of coronary heart disease, cancer, or stroke. … the authors found a direct positive relation between BMI and all-cause mortality among middle-aged men (minimum risk at BMI (kg/m2) 15-22.3, older men (minimum risk at BMI 13.5-22.3), middle-aged women (minimum risk at BMI 13.9-20.6), and older women who had undergone postmenopausal hormone replacement (minimum risk at BMI 13.4-20.6). Among older women who had not undergone postmenopausal hormone replacement, the authors found a J-shaped relation (minimum risk at BMI 20.7-27.4) in which BMI <20.7 was associated with a twofold increase in mortality risk (hazard ratio (HR) = 2.2, 95% confidence interval (CI) 1.3, 3.5) that was primarily due to cardiovascular and respiratory disease. These findings not only identify adiposity as a risk factor among adults, but also raise the possibility that very lean older women can experience an increased mortality risk that may be due to their lower levels of adipose tissue-derived estrogen.” |
|
|
|
|
|
A huge study of anorectics found that “Long-term survival of Rochester patients with anorexia nervosa did not differ from that expected. This finding suggests that overall mortality was not increased among the spectrum of cases representative of the community.” A close look at the data shows that the death rate was only 71% of the expected rate, and of these deaths nearly half were from alcohol or suicide: I infer that this supports the life-extending effects of CR, although presumably these patients did not get optimal nutrition and were anorectic for cosmetic reasons. |
|
|
|
|
|
A 20-year, national prospective study found that “Average-adulthood BMI appears to be an appropriate predictor of mortality risk, provided baseline BMI is used as a covariate. Among non-elderly persons, being leaner meant a lower mortality risk, down to the lowest category of leanness in the study: [BMI < 20].” |
|
|
|
|
|
From a study of “115,195 U.S. women enrolled in the prospective Nurses' Health Study”: “the relative risks of death from all causes for increasing categories of body-mass index were as follows: body-mass index < 19.0 (the reference category), relative risk = 1.0; 19.0 to 21.9, relative risk = 1.2; 22.0 to 24.9, relative risk = 1.2; 25.0 to 26.9, relative risk = 1.3; 27.0 to 28.9, relative risk = 1.6; 29.0 to 31.9, relative risk = 2.1; and > or = 32.0, relative risk = 2.2 (P for trend < 0.001). Among women with a body-mass index of 32.0 or higher who had never smoked, the relative risk of death from cardiovascular disease was 4.1 (95 percent confidence interval, 2.1 to 7.7), and that of death from cancer was 2.1 (95 percent confidence interval, 1.4 to 3.2), as compared with the risk among women with a body-mass index below 19.0. A weight gain of 10 kg (22 lb) or more since the age of 18 was associated with increased mortality in middle adulthood. CONCLUSIONS. Body weight and mortality from all causes were directly related among these middle-aged women. Lean women did not have excess mortality. The lowest mortality rate was observed among women who weighed at least 15 percent less than the U.S. average for women of similar age and among those whose weight had been stable since early adulthood.” |
|
|
|
|
|
Data from the most powerful epidemiology in the world today, based on cohort size, uniformity of socioeconomic status, funding, duration, quantity & quality of data collection, the “Ten-year follow-up (1986-1996) of middle-aged women in the Nurses' Health Study and men in the Health Professionals Follow-up Study” showed that “The risk of developing diabetes, gallstones, hypertension, heart disease, and stroke increased with severity of overweight among both women and men… the dose-response relationship between BMI and the risk of developing chronic diseases was evident even among adults in the upper half of the healthy weight range (ie, BMI of 22.0-24.9), suggesting that adults should try to maintain a BMI between 18.5 and 21.9 to minimize their risk of disease.” |
|
|
|
|
|
“To establish a practical weight management program for mariners in the Japan Maritime Self-Defense Force (JMSDF) Fleet Escort Force, the relationship between morbidity and body mass index (BMI) was studied. To estimate morbidity, 10 medical problems were used as indices (hyperlipidemia, hyperuricemia, diabetes mellitus, lung disease, heart disease, upper gastrointestinal tract disease, hypertension, renal disease, liver disease, and anemia). A curvilinear relationship was found between morbidity and BMI, in which a BMI of 17.5 was associated with the lowest morbidity…aiming for a BMI of 17.5 will help in the design and implementation of a practical management program for health promotion in the JMSDF.” |
|
|
|
Mental function |
Alzheimer’s prevention |
“… it would seem prudent (based on existing data) to recommend DR as widely applicable preventative approach for age-related disorders including neurodegenerative disorders.” (DR = diet restriction) |
|
|
|
|
|
“Higher intake of calories and fats may be associated with higher risk of AD in individuals carrying the apolipoprotein E epsilon4 allele.” (AD = Alzheimer’s disease; Hazard ratio for highest quartile = 2.3) |
|
|
|
|
|
A large, population/country-based review considering many factors finds that “The primary findings are that fat and total caloric supply have the highest correlations with Alzheimer’s disease prevalence rates (r2 = 0.932 and 0.880, respectively).” |
|
|
|
|
|
Alzheimer’s disease: Greatly reduced risk with low BMI. “During the 18-year follow-up …, 93 participants were diagnosed as having dementia. Women who developed dementia between ages 79 and 88 years were overweight, with a higher average BMI at age 70 years (27.7 vs 25.7; P =.007), 75 years (27.9 vs 25.0; P<.001), and 79 years (26.9 vs 25.1; P =.02) compared with nondemented women. … For every 1.0 increase in BMI at age 70 years, [Alzheimer’s Disease] risk increased by 36%.” |
|
|
|
|
|
“SETTING: Kaiser Permanente Northern California ... PARTICIPANTS: 10,276 men and women who underwent detailed health evaluations from 1964 to 1973 when they were aged 40-45 and who were still members of the health plan in 1994. MAIN OUTCOME MEASURES: Diagnosis of dementia from January 1994 to April 2003. Time to diagnosis was analysed with Cox proportional hazard models adjusted for age, sex, race, education, smoking, alcohol use, marital status, diabetes, hypertension, hyperlipidaemia, stroke, and ischaemic heart disease. RESULTS: Dementia was diagnosed in 713 (6.9%) participants. Obese people (body mass index > or = 30) had a 74% increased risk of dementia (hazard ratio 1.74, 95% confidence interval 1.34 to 2.26), while overweight people (body mass index 25.0-29.9) had a 35% greater risk of dementia (1.35, 1.14 to 1.60) compared with those of normal weight (body mass index 18.6-24.9). Compared with those in the lowest fifth, men and women in the highest fifth of the distribution of subscapular or tricep skinfold thickness had a 72% and 59% greater risk of dementia, respectively (1.72, 1.36 to 2.18, and 1.59, 1.24 to 2.04). CONCLUSIONS: Obesity in middle age increases the risk of future dementia independently of comorbid conditions.” |
|
|
|
|
Reduced risk of Alzheimer and Parkinson disease |
“Epidemiologic findings suggest that high-calorie diets and folic acid deficiency increase the risk for Alzheimer disease and Parkinson disease” "The emerging epidemiologic and experimental data described earlier, together with the fact that dietary restriction consistently increases life span in all mammals studied to date, provide a strong rationale for future studies in humans to determine whether dietary restriction will reduce the risk for age-related neurodegenerative disorders. Dietary restriction may not only benefit obese persons (body mass index > 25 kg/m2); it may also reduce the risk for disease in persons whose body weights are within the "normal" range (body mass index between 20 and 25 kg/m2)." |
|
|
|
|
|
Report of a study of 1449 patients by M. Kivipelto: obesity, HTN and high cholesterol (when tested at age 50) each double the risk of AD occurring 21 years later. |
|
|
|
|
Reduced loss of brain tissue |
Eat more, lose your brain. “Multivariate analyses showed that age and BMI were the only significant predictors of temporal [lobe] atrophy. Risk of temporal atrophy increased 13 to 16% per 1.0-kg/m(2) increase in BMI (p < 0.05).” |
|
|
|
|
|
Eat more, lose your brain. “7402 apparently healthy men aged 47 to 55 at baseline were followed-up over a 28-year period…A total of 873 first strokes were recorded, including 495 ischemic, 144 hemorrhagic, and 234 unspecified strokes. Compared with men with low normal weight (BMI, 20.0 to 22.49 kg/m(2)), men with BMI >30.0 kg/m(2) had a multiple adjusted hazard ratio of 1.93 (95% CI, 1.44 to 2.58) for total stroke, 1.78 (95% CI, 1.22 to 2.60) for ischemic stroke, and 3.91 (95% CI, 2.10 to 7.27) for unspecified stroke… The result supports the role of mid-life BMI as a risk factor for stroke later in life and suggests a differentiated effect on stroke subtypes.” |
|
|
|
|
Reduced cognitive decline |
“… subjects with a BMI greater or equal than 23 kg/m(2) had 3.6 times lower chance of presenting a decline in the subsequent 5 y … BMI ranging between 23 and 27 was associated with a significantly decreased risk of [instrumental activities of daily living] disability [compared to BMI > 27] (OR=0.31, 95% CI 0.10-0.93) in multivariate analyses. CONCLUSION: In apparently healthy elderly people a BMI ranging between 23 and 27 is associated with lower risks of functional and cognitive declines in the subsequent 5 y.” |
|
|
|
|
|
“In this prospective cohort study, we analyzed data from 2,223 healthy workers aged 32 to 62 years at baseline. Medical, psychosocial, and environmental data were collected in 1996 and in 2001. We tested cognitive functions at baseline and at follow-up with word-list learning (four recalls), a Digit-Symbol Substitution Test, and a selective attention test. RESULTS: Cross-sectionally, a higher BMI was associated with lower cognitive scores after adjustment for age, sex, educational level, blood pressure, diabetes, and other psychosocial covariables. A higher BMI at baseline was also associated with a higher cognitive decline at follow-up, after adjustment for the above-cited confounding factors. This association was significant for word-list learning. For the changes in scores at word-list learning (delayed recall), regression coefficients were -0.008 +/- 0.13, -0.09 +/- 0.13, -0.17 +/- 0.14, and -0.35 +/- 0.14 (p for trend < 0.001) for the second, third, fourth, and fifth quintiles of BMI at baseline when compared with the first quintile.” |
|
|
|
|
|
(Framingham study) “The adverse effects of obesity and hypertension in men are independent and cumulative with respect to cognitive deficit.” |
|
|
|
|
|
(Review) “Dietary restriction (reduced calorie intake with nutritional maintenance) can extend lifespan and may increase the resistance of the nervous system to age-related diseases including neurodegenerative disorders.” |
|
|
|
|
Reduced risk of multiple sclerosis |
“The relation between nutritional factors and MS was studied among 197 incident cases and 202 frequency matched controls in metropolitan Montreal during 1992-1995. … An inverse association was observed between high body mass index (BMI) and the risk of MS, with an odds ratio (OR) of 0.76 (95% confidence interval [CI]: 0.61-0.95), per 5-unit increase in BMI, both sexes combined. … The study generally supports a protective role for components commonly found in plants (fruit/vegetables and grains) and an increased risk with high energy and animal food intake.” |
|
|
|
|
Reduced risk of Parkinson Disease |
“…rates of [Parkinson Disease] were lowest in the bottom quartile of BMI” |
|
|
|
|
Reduced risk of stroke |
“There was a positive association across the whole range of BMI and ischemic stroke, with a confounder-adjusted hazard of 11% … for 1 kg/m2 higher BMI.” In other words, your risk of stroke goes up 11% for each unit higher BMI! |
|
|
|
|
|
“This prospective study explored risk factors for stroke in subjects with normal BP. METHODS: A total of 11,228 men and 17,174 women, 45 to 73 years old, were examined in a population-based cohort study… Cox-regression analysis, age (per 1 year; relative risk [RR], 1.12), current smoking (RR, 3.21), BMI (per SD; RR, 1.39), high-normal diastolic BP (RR, 2.35), history of CHD (RR, 4.92), and gastric ulcer (RR, 2.21) remained significantly associated with incidence of stroke.” |
|
|
|
|
|
“During 10.4 years of follow-up, 132 persons developed [ischemic stroke]. Hazard ratios of subjects with 1 to 2 and > or =3 [metabolic syndrome] component disorders were … 3.16 and 5.15, respectively, under the 2005 definition [of metabolic syndrome] (all P values <0.05).” |
|
|
|
Reduced risk of disease with low BMI |
|
Arthritis, diabetes, hypertension, and other diseases have reduced risk in men and women with lower BMIs. |
|
|
|
|
|
“Overall, 37 of 41 conditions examined for women and 29 of 41 conditions examined for men were associated with increased levels of BMI (trend p <0.05 for all models). For women and men, respectively, the highest ORs comparing obese II/III to normal weight were diabetes (OR=12.5 and 8.3), knee replacement (OR=11.7 and 6.1), and hypertension (OR=5.4 and 5.6). Obesity also increased the odds of several rare diseases such as pancreatitis (OR=1.9 and 1.5) and health complaints such as chronic fatigue (OR=3.7 and 3.5) and insomnia (OR=3.5 and 3.1).” |
|
|
|
|
|
A 10-year study of men and women suggested “that adults should try to maintain a BMI between 18.5 and 21.9 to minimize their risk of disease.” |
|
|
|
|
Diabetes |
Reduced risk of diabetes: “91% of type 2 diabetes is attributable to lifestyle, primarily to being overweight” |
|
|
|
|
|
Low waist circumference also reduces risk. I think of it this way: if your higher BMI is due to muscle, you are less likely to get DM than someone with a high BMI from fat. “Age-adjusted relative risks (RRs) across quintiles of WC were 1.0, 2.0, 2.7, 5.0, and 12.0; … those of BMI were 1.0, 1.1, 1.8, 2.9, and 7.9” |
|
|
|
|
Atopic dermatitis |
Atopic dermatitis: “The change in the inflammatory intensity score and the change in BMI caused by energy restriction showed a significant positive correlation. The change in oxidative DNA damage levels and the change in BMI showed a positive correlation. These results clarify the relationship between weight loss and the improvement of [atopic dermatitis]. It may be hypothesized that this low-energy diet which included several additional nutrients has a possibility to reduce inflammatory symptoms of patients with [atopic dermatitis].” |
|
|
|
|
Atopy markers |
“The frequency of specific IgE in the obese group was almost 3 times that in the nonobese group (P = 0.008).” |
|
|
|
|
Macula degeneration |
Reduced risk of macula degeneration (AMD), perhaps the most common cause of blindness in old people This study also found that hypertension and smoking are associated with AMD. |
|
|
|
|
Cataract |
Reduced rate of cataract: “Obesity increases the risk of developing cataract overall, and of PSC cataract in particular” [relative risk for PSC cataract = 1.68] |
|
|
|
|
High intraocular pressure |
“Two thousand nine hundred eighty-seven Japanese male aircraft crew members underwent IOP measurement by Goldmann apparatus and received physical and complete ophthalmologic examinations every year for 10 years… The trend of IOP was significantly positively associated with the trends of systemic factors: body mass index (BMI) (B = 0.117/0.119), blood pressure (systolic) (B = 0.020/0.020), and hematocrit (B = 0.057/0.045)...” |
|
|
|
|
Renal damage |
Reduced age-related kidney damage |
|
|
|
|
Cancer |
Reduction in cancer incidence, directly proportional to weight, including at least the following cancers: prostate,151 colon, breast, endometrium, kidney, esophagus152 |
|
|
|
|
|
A LARGE long-term study reported in the NEJM showed that “In both men and women, body-mass index was also significantly associated with higher rates of death due to cancer of the esophagus, colon and rectum, liver, gallbladder, pancreas, and kidney; the same was true for death due to non-Hodgkin's lymphoma and multiple myeloma. Significant trends of increasing risk with higher body-mass-index values were observed for death from cancers of the stomach and prostate in men and for death from cancers of the breast, uterus, cervix, and ovary in women. On the basis of associations observed in this study, we estimate that current patterns of overweight and obesity in the United States could account for 14 percent of all deaths from cancer in men and 20 percent of those in women.” |
|
|
|
|
|
“In women, after adjustment for potential confounders, the RR of all cancers associated with different BMI, relative to a BMI of 18.5-24.9, were 1.04 (95% CI = 0.85-1.27) for BMI = 25.0-27.4, 1.29 (1.00-1.68) for BMI = 27.5-29.9 and 1.47 (1.06-2.05) for BMI >/=30.0 (p for trend = 0.007).” n.b., there was not so great an effect in men. |
|
|
|
|
|
“…a low body weight and high level of physical activity, has been more convincingly related to lower cancer rates.” |
|
|
|
|
|
“The
effect of body mass index (BMI, kg/m2) on overall
cancer risk and on risk of developing several common cancer types
was examined in a population-based cohort study. .. 35,362 women
and 33,424 men recruited in the Northern Sweden Health and Disease
Cohort between 1985 and 2003. .. Women with BMI > 27.1 (top
quartile) had a 29% higher risk of developing any
malignancy compared to women with BMI of 18.5-22.2 (lowest
quartile), which increased to 47% in analysis limited to
nonsmokers. ..obese women (BMI
|
|
|
|
|
Kidney cancer |
“We examined the health records of 363,992 Swedish men who underwent at least one physical examination from 1971 to 1992 and were followed until death or the end of 1995… RESULTS: As compared with men in the lowest three eighths of the cohort for body-mass index, men in the middle three eighths had a 30 to 60 percent greater risk of renal-cell cancer, and men in the highest two eighths had nearly double the risk (P for trend, <0.001). There was also a direct association between higher blood pressures and a higher risk of renal-cell cancer (P for trend, <0.001 for diastolic pressure; P for trend, 0.007 for systolic pressure).” |
|
|
|
|
|
“The authors conducted a population-based case-control study of 810 cases with histologically confirmed incident kidney cancer and 3,106 controls to assess the effect of obesity, energy intake, and recreational physical activity on renal cell and non-renal cell cancer risk in Canada from 1994 to 1997. Compared with normal body mass index (BMI; 18.5 to <25.0 kg/m(2)), obesity (BMI, >/=30.0 kg/m(2)) was associated with multivariable-adjusted odds ratios (OR) and 95% confidence intervals (95% CI) of 2.57 … for renal cell cancer and 2.79 … for non-renal cell cancer.” N.b., physical activity had no effect. |
|
|
|
|
Prostate cancer |
“…observations suggest that obesity may be a risk factor for prostate cancer… studies have more conclusively shown that obesity is associated with prostate cancer mortality… studies have found that in men who underwent radical prostatectomy for localized prostate cancer, a higher BMI was associated with higher-grade tumors [12,13] and nonorgan-confined disease [14]. These studies suggest that although obesity may not make it more likely for one to develop prostate cancer, it may make it more likely that one develops a higher-grade, more lethal prostate cancer.” |
|
|
|
|
|
“We examined body mass index (BMI) and weight change in relation to incident prostate cancer by disease stage and grade at diagnosis among 69,991 men in the Cancer Prevention Study II Nutrition Cohort. Participants provided information on height and weight in 1982, and again at enrollment in 1992. During follow-up through June 30, 2003 (excluding the first 2 years of follow-up), we documented 5,252 incident prostate cancers... BMI was inversely associated with risk of nonmetastatic low-grade prostate cancer (RR, 0.84; 95% CI, 0.66-1.06), but BMI was positively associated with risk of nonmetastatic high-grade prostate cancer (RR, 1.22; 95% CI, 0.96-1.55) and risk of metastatic or fatal prostate cancer (RR, 1.54; 95% CI, 1.06-2.23). Compared with weight maintenance, men who lost >11 pounds between 1982 and 1992 were at a decreased risk of nonmetastatic high-grade prostate cancer (RR, 0.58; 95% CI, 0.42-0.79).CONCLUSION: Obesity increases the risk of more aggressive prostate cancer and may decrease either the occurrence or the likelihood of diagnosis of less-aggressive tumors. Men who lose weight may reduce their risk of prostate cancer.” |
|
|
|
|
|
Indirect evidence: tall men get more prostate cancer. Since tall people tend to weigh more and eat more, this could be interpreted as a weak proxy for “increased calories => increased prostate cancer”. “29,119 Finnish male smokers 50 to 69 years old had height and weight measured by trained personnel, provided information on demographic, smoking, medical, and other characteristics, and completed an extensive diet history questionnaire. A total of 1,346 incident prostate cancer cases were identified during a follow-up period of up to 17.4 years (median, 14.1 years). In age-adjusted Cox proportional hazards models, the hazard ratios and 95% confidence intervals for prostate cancer according to increasing quintiles of height [<or=168, 169-171, 172-175, 176-178, and >178 cm] were 1.00 (reference), 1.11 (0.93-1.32), 1.11 (0.95-1.31), 1.30 (1.01-1.55), and 1.14 (0.96-1.35); P(trend) = 0.04. In analyses stratified by disease stage (available for 916 cases), a strong dose-response relationship was observed between greater height and advanced, but not earlier-stage, disease [tumor-node-metastasis stage III-IV, hazard ratio and 95% confidence interval for increasing quintiles of height: 1.77 (1.18-2.65), 1.82 (1.25-2.65), 1.93 (1.29-2.90), and 2.02 (1.37-2.97); P(trend) = 0.0008, P(interaction) = 0.002]. Our study provides additional evidence that increased height is a risk factor for prostate cancer and suggests that taller men are particularly susceptible to advanced disease.” |
|
|
|
|
Pancreas cancer |
A very large case-control study found a 2-fold increase in pancreas cancer in those in the top quartile of BMI vs. those in the bottom quartile. |
|
|
|
|
Breast cancer |
An epidemiologic study of anorectic women found that “Compared with the Swedish general population, women hospitalized for anorexia nervosa prior to age 40 years had a 53% … lower incidence of breast cancer; … Severe caloric restriction in humans may confer protection from invasive breast cancer.” |
|
|
|
|
Colon cancer |
“Body mass index (BMI) at baseline and 20 y of age (B-BMI and 20-BMI, respectively) were calculated… Women with B-BMI >/=28 … had a relative risk (RR) of 3.41 … compared with those with BMI of 20-<22… 20-BMI also presented the same trend of increasing risk as B-BMI. Women with 20-BMI of <22 and B-BMI of >26…, that is, excessive BMI gain, had a high RR of 3.41 … compared with those with 20-BMI of <22 and B-BMI of <22” |
|
|
|
|
|
“A BMI >/=30 led to a 50% increased risk… of colon cancer among middle-aged (30-54 y) and a 2.4-fold increased risk … among older (55-79 y) adults.” |
|
|
|
|
|
“Large prospective studies show a significant association with obesity for several cancers, and the International Agency for Research on Cancer has classified the evidence of a causal link as 'sufficient' for cancers of the colon, female breast (postmenopausal), endometrium, kidney (renal cell), and esophagus (adenocarcinoma). These data, and the rising worldwide trend in obesity, suggest that overeating may be the largest avoidable cause of cancer in nonsmokers… we estimate that overweight and obesity now account for one in seven of cancer deaths in men and one in five in women in the US.” |
|
|
|
|
|
Reduced risk of uterine & breast cancer. This large study of Swedish twins found that low BMI was associated with less of these two cancers; low BMI did not appear to help prevent prostate cancer. |
|
|
|
|
|
Reduced risk of rectal cancer. “Men and women with lifetime maximum [BMI > 30] had [an odds ratio] of 1.70 … Our study provides evidence that physical inactivity, high energy intake and obesity are associated with the risk of rectal cancer, and there is a probable synergic effect among the 3 risk factors.” |
|
|
|
|
|
In essence, the more you eat the higher your risk. The relative risk in men “of colon cancer per unit increase in BMI was 1.04” (4% increase per unit BMI). “The risk of colon cancer increased with increasing BMI in men, and the risk of gallbladder cancer increased with increasing BMI in women. In both sexes, the risk of colon cancer increased with increasing height.” |
|
|
|
|
|
“We used multivariable adjusted Cox proportional hazards models to examine the association between anthropometric measures and risks of colon and rectal cancer among 368 277 men and women who were free of cancer at baseline from nine countries of the European Prospective Investigation Into Cancer and Nutrition. All statistical tests were two-sided. RESULTS: During 6.1 years of follow-up, we identified 984 and 586 patients with colon and rectal cancer…Waist circumference and [waist-to-hip ratio], indicators of abdominal obesity, were strongly associated with colon cancer risk in men and women in this population.” |
|
|
|
|
Non-Hodgkin lymphoma |
“In a multivariable model to predict risk of diffuse NHL, BMI (OR = 2.15 for 35+ versus <25 kg/m2; 95% CI 1.09-4.25) and height (OR = 1.63 for 71+ versus <65 inches; 95% CI 0.75-3.57) were positively associated with risk” |
|
|
|
|
Stroke |
“This was a prospective cohort study among 39 053 women participating in the Women's Health Study… BMI was a strong risk factor for total and ischemic stroke but not for hemorrhagic stroke. The association was highly mediated by hypertension, diabetes, and elevated cholesterol.” |
|
|
|
|
Heart disease |
Low BMI in childhood => reduced risk of heart disease in subsequent adult life. “All-cause and cardiovascular mortality were associated with higher childhood BMIs. Compared with those with BMIs between the 25th and 49th centiles, the hazard ratio (95% CI) for all-cause mortality in those above the 75th BMI centile for their age and sex was 1.5 (1.1, 2.2) and for ischemic heart disease it was 2.0 (1.0, 3.9).” |
|
|
|
|
|
“High BMI contributed independently and significantly to incident [coronary heart disease]” |
|
|
|
|
|
Obesity and overweight increase risk of death, even above and beyond their effects on known cardiac risk factors (cholesterol & HTN). In a 2006 JAMA study, “17,643 men and women aged 31 through 64 years… free of coronary heart disease (CHD), diabetes, or major electrocardiographic abnormalities at baseline. MAIN OUTCOME MEASURES: Hospitalization and mortality from CHD, cardiovascular disease, or diabetes, beginning at age 65 years. RESULTS: In multivariable analyses that included adjustment for systolic blood pressure and total cholesterol level, the odds ratio (95% confidence interval) for CHD death for obese participants compared with those of normal weight in the same risk category was 1.43 (0.33-6.25) for low risk and 2.07 (1.29-3.31) for moderate risk; for CHD hospitalization, the corresponding results were 4.25 (1.57-11.5) for low risk and 2.04 (1.29-3.24) for moderate risk. Results were similar for other risk groups and for cardiovascular disease, but stronger for diabetes (eg, low risk: 11.0 [2.21-54.5] for mortality and 7.84 [3.95-15.6] for hospitalization). CONCLUSION: For individuals with no cardiovascular risk factors as well as for those with 1 or more risk factors, those who are obese in middle age have a higher risk of hospitalization and mortality from CHD, cardiovascular disease, and diabetes in older age than those who are normal weight.” |
|
|
|
|
|
“Doppler echocardiography has established the pattern of aging-associated DF [Diastolic Function] impairment, whereas little change is observed in systolic function (SF). METHODS: Diastolic function was assessed in 25 subjects (age 53 +/- 12 years) practicing CR for 6.5 +/- 4.6 years and 25 age- and gender-matched control subjects consuming Western diets. Diastolic function was quantified by transmitral flow, Doppler tissue imaging, and model-based image processing (MBIP) of E waves. C-reactive protein (CRP), tumor necrosis factor-alpha (TNF-alpha), and transforming growth factor-beta(1) (TGF-beta(1)) were also measured. RESULTS: No difference in SF was observed between groups; however, standard transmitral Doppler flow DF indexes of the CR group were similar to those of younger individuals, and MBIP-based, flow-derived DF indexes, reflecting chamber viscoelasticity and stiffness, were significantly lower than in control subjects. Blood pressure, serum CRP, TNF-alpha, and TGF-beta(1) levels were significantly lower in the CR group (102 +/- 10/61 +/- 7 mm Hg, 0.3 +/- 0.3 mg/l, 0.8 +/- 0.5 pg/ml, 29.4 +/- 6.9 ng/ml, respectively) compared with the Western diet group (131 +/- 11/83 +/- 6 mm Hg, 1.9 +/- 2.8 mg/l, 1.5 +/- 1.0 pg/ml, 35.4 +/- 7.1 ng/ml, respectively). CONCLUSIONS: Caloric restriction has cardiac-specific effects that ameliorate aging-associated changes in DF.” |
|
|
|
|
|
Even in healthy middle-age people, being overweight increases progression of coronary artery calcification (CAC). “Among 329 participants (74.3%) in the lower-risk group, waist circumference (P=0.024), waist-to-hip ratio (P<0.001), body mass index (P=0.036), and being overweight compared with being underweight or of normal weight (P=0.008) were each significantly positively associated with progression of CAC.” |
|
|
|
|
|
A large waist combined with elevated triglycerides => 3.2-fold increase in fatal cardiovascular events. |
|
|
|
|
|
“Body fatness is a better predictor of CVD risk factor profile than aerobic fitness in healthy men.” |
|
|
|
|
|
“New-onset postoperative atrial fibrillation (AF) is a common complication of cardiac surgery that has substantial effects on outcomes. In the general (nonsurgical) adult population, AF has been linked to increasing obesity, which correlates with left atrial enlargement. …Covariate-adjusted ORs for AF were systematically greater for larger patients than for patients in the normal group (adjusted OR [95% CI]=1.18 [1.00 to 1.40], 1.36 [1.14 to 1.63], 1.69 [1.35 to 2.11], and 2.39 [1.81 to 3.17] for overweight, obese I, obese II, and obese III, respectively)... CONCLUSIONS: Obesity is an important determinant of new-onset AF after cardiac surgery.” |
|
|
|
|
|
An increase in BMI of 3 in middle age => increase in heart disease risk score. “The purpose of the study is to examine the association between longitudinal change in body mass index (BMI) and change in coronary heart disease (CHD) risk score by using the Framingham risk score equation. …We observed a significant association between BMI change and risk score change in all baseline age groups. … A BMI increase of 3 kg/m(2) in subjects aged 40 to 49 years was associated with risk score increases of 0.45 points (95% confidence interval [CI], 0.29-0.62) in men and 0.66 points (95% CI, 0.52-0.80) in women.”
A Framingham risk score calculator is available on the web at this site: |
|
|
|
|
|
WAIST SIZE MATTERS TOO. What determines waist size within a given BMI? Probably where the mass is: if it is in fat, it will settle in your abdomen; if in muscle, it will be on your limbs. Thus, in this study, waist size may simply be a surrogate for lack of exercise. “The authors conducted a cohort study among 101,765 adult members of Kaiser Permanente of Northern California who underwent multiphasic health checkups between 1965 and 1970. After a median of 12 years and adjustment for age, race, body mass index (BMI), educational level, smoking, alcohol consumption, and hormone replacement therapy (in women), the upper quartile of standing sagittal abdominal diameter, relative to the lowest quartile, was associated with a 1.42-fold increased hazard of CHD in men (95% confidence interval: 1.30, 1.55) and a 1.44-fold increased hazard of CHD in women (95% confidence interval: 1.30, 1.59). Further adjustment for metabolic mediators attenuated the association minimally. Standing sagittal abdominal diameter was a consistent predictor of CHD across racial groups but was more strongly associated with CHD in the younger age group. Joint consideration of BMI/standing sagittal abdominal diameter categories better discriminated risk of CHD compared with use of BMI alone. In conclusion, standing sagittal abdominal diameter was a strong predictor of CHD independently of BMI and added incremental CHD risk prediction at each level of BMI.” |
|
|
|
|
Disability |
Reduced disability with lower levels of fat “…in 2714 women and 2095 men aged 65-100 y…A positive association was observed between fat mass and disability. The odds ratio for disability in the highest quintile of fat mass was 3.04 (95% CI: 2.18, 4.25) for women and 2.77 (95% CI: 1.82, 4.23) for men compared with those in the lowest quintile…The results showed that high body fatness is an independent predictor of mobility-related disability in older men and women.” |
|
|
|
|
|
“Both higher Body Mass Index (BMI) and shorter time spent walking were significantly associated with an increased risk of long-term disability (more than 6 months). The odds ratios of long-term disability were 1.3 in those with BMI 20-25 and 2.1 in those with BMI >25, compared with BMI <20. The odds ratios of long-term disability were 1.3 in those walking for 0.5-0.9 h/day and 1.7 in those walking for <0.5 h/day, compared with those walking for >1.0 h/day.” |
|
|
|
|
Asthma |
“Compared with persons with a body mass index … of less than 25, overweight…men and women had relative risks of asthma of 1.27 … and 1.30…, respectively, while obese … men and women had relative risks of 1.78 … and 1.99 ..., respectively…The risk of asthma increased steadily with body mass index, from a body mass index of 20 in men and of 22 in women. In men, the risk of asthma increased by 10% with each unit of increased body mass index between 25 and 30. The similar value for women was 7%.” |
|
|
|
|
Gout |
“Compared with men with a body mass index (BMI) of 21 to 22.9, the multivariate relative risks (RRs) of gout were 1.95 (95% confidence interval [CI], 1.44-2.65) for men with a BMI of 25 to 29.9, 2.33 (95% CI, 1.62-3.36) for men with a BMI of 30 to 34.9, and 2.97 (95% CI, 1.73-5.10) for men with a BMI of 35 or greater (P for trend <.001)… In our cohort, 41% of the incident gout cases were attributable to a BMI of 23 or greater…Higher adiposity and weight gain are strong risk factors for gout in men, while weight loss is protective.” |
|
|
|
|
Arthritis |
Reduction in rheumatoid arthritis |
|
|
|
|
|
Reduced rheumatoid arthritis and the AGE (pentosidine) associated with RA activity. |
|
|
|
|
|
Greatly reduced hip osteoarthritis “Higher body mass index was associated with an increased risk of hip replacement due to osteoarthritis (P for trend = 0.0001).” |
|
|
|
|
|
Reduced atherosclerosis and heart disease |
|
|
|
|
|
>3-fold reduced risk. “Arthritis was based on self-report of doctor diagnosis or chronic joint symptoms… Overall, 31.7% of respondents had self-reported arthritis. There was a strong relationship between body weight and arthritis. Specifically, the prevalence of arthritis was 25.9% among normal weight (18.5 to 24.9 body mass index [BMI]) adults; 32.1% among overweight (25 to 29.9 BMI) adults; and 43.5% among obese (>30 BMI) adults. This association persisted after adjusting for other factors (adjusted odds ratio [AOR] for having arthritis among obese individuals compared with healthy weight individuals, 3.6” |
|
|
|
|
Inflammation |
“Chronic systemic inflammation, as evidenced by higher than normal cytokines (interleukin-6, tumor necrosis factor alpha; IL-6, TNF[alpha]) and the acute-phase reactant C-reactive protein (CRP), is an independent predictor of several chronic diseases, including coronary heart disease, stroke, and diabetes. As an endocrine organ, adipose tissue produces and secretes a number of inflammatory cytokines. There is strong evidence that high concentrations of inflammatory markers are associated with total, and especially abdominal, adiposity. Lifestyle modifications, such as weight loss and exercise, have been advocated for the treatment of obesity and the metabolic syndrome. Several studies now show that weight loss via caloric restriction reduces concentrations of inflammatory markers in obese individuals. While it is well established that strenuous exercise acutely increases levels of circulating cytokines and CRP, recent evidence indicates that long-term exercise training may reduce chronic inflammation. In observational studies, lower levels of several inflammatory markers, are found in individuals who are the most physically active and the most physically fit. Moreover, some intervention studies show that chronic exercise training reduces circulating concentrations of cytokines or their soluble receptors. Addition of exercise training to caloric restriction is more effective than weight loss alone in reducing chronic inflammation in obese individuals. In addition, modification of chronic inflammation is associated with changes in abdominal, but not gluteal, adipose tissue lipolysis in response to weight loss and exercise, suggesting that regional fat metabolism may also be related to chronic inflammation in obese individuals.” |
|
|
|
|
Depression |
Increased risk of depression in obese people (and therefore reduced risk in thin people) |
|
|
|
|
|
BMI > 30 => 75% increased rate of major depression; BMI > 40 => 500% increased rate of major depression. |
|
|
|
|
Heartburn |
From the Nurses' Health Study. “After categorizing women according to BMI as measured in 1998, we used logistic-regression models to study the association between BMI and symptoms of gastroesophageal reflux disease. RESULTS: Of 10,545 women who completed the questionnaire (response rate, 86 percent), 2310 (22 percent) reported having symptoms at least once a week, and 3419 (55 percent of those who had any symptoms) described their symptoms as moderate in severity. We observed a dose-dependent relationship between increasing BMI and frequent reflux symptoms (multivariate P for trend <0.001). As compared with women who had a BMI of 20.0 to 22.4, the multivariate odds ratios for frequent symptoms were 0.67 (95 percent confidence interval, 0.48 to 0.93) for a BMI of less than 20.0, 1.38 (95 percent confidence interval, 1.13 to 1.67) for a BMI of 22.5 to 24.9, 2.20 (95 percent confidence interval, 1.81 to 2.66) for a BMI of 25.0 to 27.4, 2.43 (95 percent confidence interval, 1.96 to 3.01) for a BMI of 27.5 to 29.9, 2.92 (95 percent confidence interval, 2.35 to 3.62) for a BMI of 30.0 to 34.9, and 2.93 (95 percent confidence interval, 2.24 to 3.85) for a BMI of 35.0 or more. Even in women with a normal baseline BMI, an increase in BMI of more than 3.5, as compared with no weight changes, was associated with an increased risk of frequent symptoms of reflux (odds ratio, 2.80; 95 percent confidence interval, 1.63 to 4.82)... Even moderate weight gain among persons of normal weight may cause or exacerbate symptoms of reflux.” |
|
|
|
|
Hypertension |
Hypertension “We prospectively followed 8302 Finnish men and 9139 women aged 25 to 64 years without a history of antihypertensive drug use, coronary heart disease, stroke, and heart failure at baseline… Multivariate-adjusted hazards ratios of hypertension associated with light, moderate, and high physical activity were 1.00, 0.63, and 0.59 in men (Ptrend<0.001), and 1.00, 0.82, and 0.71 in women (Ptrend=0.005), respectively. This association persisted both in subjects who were overweight and in those who were not. Multivariate-adjusted hazards ratios of hypertension based at different levels of body mass index (<25, 25 to 29.9, and >/=30) were 1.00, 1.18, and 1.66 for men (Ptrend<0.001), and 1.00, 1.24, and 1.32 for women (Ptrend=0.007), respectively.” |
|
|
|
|
|
Reduced high blood pressure: “a decrease in body weight by 1 kg resulted in a reduction of systolic and diastolic pressure by 1.2 and 1.0 mmHg, respectively.” |
|
|
|
|
|
A recent, large meta-analysis of “Twenty-five randomized, controlled trials (comprising 34 strata) published between 1966 and 2002 with a total of 4874 participants” showed that a decrease in body weight by 1 kg resulted in a reduction of systolic and diastolic pressure by 1.05 and 0.92 mmHg, respectively. |
|
|
|
|
|
High BMI, large waist and weight gain all lead to arterial stiffness. “These data show strong associations between weight gain and arterial stiffness progression, as well as between weight loss and arterial stiffness regression.” |
|
|
|
|
|
A systematic review of the long-term pressure effects of weight loss showed “that for 10 kg weight loss, decreases of 4.6 mm Hg and 6.0 mm Hg in diastolic and systolic blood pressure, respectively, may be expected, about half of that predicted from the short-term trials.” |
|
|
|
|
|
“Our result supports an independent effect of change in BMI on change in SBP and DBP in both women and men, and that people who increase their BMI are at increased risk for hypertension.” |
|
|
|
|
Obesity in adolescence => obesity and early death in adult life |
“In Norwegian health surveys during 1963-1999, height and weight were measured for 128,121 persons in a standardized way both in adolescence (age 14-19 years) and 10 or more years later… The odds ratio of obesity (BMI >/=30) in adulthood increased steadily with BMI in adolescence, from 0.2 for low BMI up to 16 for very high BMI. Very high adolescent BMI was associated with 30-40% higher adult mortality compared with medium BMI… Obesity in adolescence tends to persist into adulthood… High BMI in adolescence seems to be predictive of both adult obesity and mortality.” |
|
|
|
|
Pre-eclampsia |
“We studied 1179 primiparous women who enrolled at < 16 weeks' gestation into a prospective cohort study of the pathogenesis of preeclampsia. Multivariable logistic regression was used to quantify the independent effect of prepregnancy BMI on the risk of preeclampsia after adjusting for race and smoking status... Compared with women with a BMI of 21, the adjusted risk of preeclampsia doubled at a BMI of 26 (odds ratio 2.1 [95% confidence interval, 1.4, 3.4]), and nearly tripled at a BMI of 30 (2.9 [1.6, 5.3]). Women with a BMI of 17 had a 57% reduction in preeclampsia risk compared with women with a BMI of 21 (0.43 [0.25, 0.76]), and a BMI of 19 was associated with a 33% reduction in risk (0.66 [0.50, 0.87]).” |
|
|
|
|
Reduced risk with low calorie diet |
The
following is data from the Okinawa Centenarian Study presented at
the American Geriatrics Society annual meeting, 2001: "Compared
with Americans, Okinawan elders |
64 |
|
|
|
|
Reduced Alzheimer’s disease. "The relative risk for development of Alzheimer disease (AD) was 0.4 among individuals in the lowest caloric intake quartile (p = 0.004)" |
|
|
|
|
|
Prostate cancer risk is directly correlated with calorie intake: “Total energy intake was positively associated with prostate cancer. Compared with the lowest quintile of energy intake, the odds ratio for the highest quintile was 3.79 (95% confidence interval 1.52 to 9.48, P TREND = 0.002).” |
|
|
|
|
|
Benign
prostate hypertrophy (BPH) risk rises with caloric intake (and
less so with protein and EPA/DHA/AA intake). A retrospective study
showed “[Odds ratios] rose with increasing total energy intake
in a comparison of the highest and lowest quintiles for
total BPH (OR: 1.29; 95% CI: 1.14, 1.45) and symptoms
of BPH (1.43; 1.23, 1.66).” |
|
|
|
|
|
In a careful, case-control study of colon cancer, the main two significant factors were calories and fiber. Calories alone could explain much of the predilection for colon cancer in African-Americans. |
|
|
|
|
|
Eating less in childhood => reduced risk of cancer in subsequent adult life. “Significant associations between childhood energy intake and cancer mortality were seen when the confounding effects of social variables were taken into account in proportional hazards models (relative hazard for all cancer mortality 1.15 (95% confidence interval 1.06 to 1.24), P = 0.001, for every MJ increase in adult equivalent daily intake in fully adjusted models)” |
|
|
|
|
|
The “biomarkers” (lab values above etc.) are better in humans on CR, and these are significant: they may predict longevity in humans. |
|
|
|
Reduced by reducing weight |
Hypertension: Losing 20 lbs should lower your blood pressure by about 15 mm Hg |
“Cross-sectional and longitudinal population studies, and intervention studies in individual subjects, suggest that hypertension can be prevented by avoiding excessive weight. Children and adolescents should particularly avoid becoming overweight as this is strongly associated with hypertension in adult life. In contrast, the hypothesis that hypertension might be reduced by restricting sodium intake is less convincing.” “Stopping excessive alcohol consumption (>30 mL ethanol per day) and restriction of caloric intake are by far the most effective lifestyle measures that consistently reduce blood pressure. In an overview of intervention studies, a 1 kg loss of weight entailed an average blood pressure decrease by 1.6 mm Hg systolic and 1.3 mm Hg diastolic.” |
|
|
|
|
|
A US Government NIH summary of “Prevention of Primary Hypertension” is available as a PDF file. It states that “A sustained weight loss of 9.7 lb (4.4kg) or more can reduce systolic and diastolic blood pressure by 5.0 and 7.0 mmHg, respectively.” and “…findings suggest that weight loss interventions produce benefits that persist long after the cessation of the active intervention.” |
|
|
|
|
To reduce risk of diabetes, CR works even when started in old age |
“Diabetes incidence rates did not differ by age in the placebo group, but [intensive lifestyle intervention, with a goal of at least 150 min/wk of activity and loss of at least 7% of body weight] was more effective with increasing age (6.3, 4.9, and 3.3 cases per 100 person-years, in the 25-44, 45-59, and 60-85 year age groups, respectively; p(trend) =.007)… results of [this study] demonstrate that an intensive lifestyle modification program is exceptionally effective in preventing diabetes in older individuals with [impaired glucose tolerance].” |
|
|
|
Risk factors |
Better on lab studies |
HDL/LDL, cholesterol, triglycerides, lipids, blood pressure, HgA1C, and CRP all more favorable in thin people; in particular those on CR |
|
|
|
|
|
From the CALERIE study: “Randomized controlled trial of healthy, sedentary men and women (N = 48) conducted between March 2002 and August 2004 at a research center in Baton Rouge, La. INTERVENTION: Participants were randomized to 1 of 4 groups for 6 months: control (weight maintenance diet); calorie restriction (25% calorie restriction of baseline energy requirements); calorie restriction with exercise (12.5% calorie restriction plus 12.5% increase in energy expenditure by structured exercise); very low-calorie diet (890 kcal/d until 15% weight reduction, followed by a weight maintenance diet). … DNA damage was also reduced from baseline in all intervention groups (P <.005). CONCLUSIONS: Our findings suggest that 2 biomarkers of longevity (fasting insulin level and body temperature) are decreased by prolonged calorie restriction in humans and support the theory that metabolic rate is reduced beyond the level expected from reduced metabolic body mass. Studies of longer duration are required to determine if calorie restriction attenuates the aging process in humans.” |
|
|
|
|
|
Biosphere 2: (i)
weight, 74 to 62 kg (men) and 61 to 54 kg (women); |
|
|
|
|
|
Those on CR have low WBC (white blood cell) counts. Interestingly, this finding is independently associated with a lower risk for cerebrovascular disease (stroke): “The adjusted relative risk of [stroke] mortality comparing those with WBC>8200 to those with WBC<5700 was 1.5 … among men and 2.7 … among women.” |
|
|
|
|
|
Reduction of C-reactive protein levels (CRP; more strongly correlated with cardiovascular disease than even LDL cholesterol, and CRP levels are not dependent on cholesterol222 ). |
|
|
|
|
|
Low BMI and waist circumference (WC) lead to better CRP and oxidized LDL (ox-LDL) levels. “cross-sectional study…Multivariate logistic regression analysis adjusted for lifestyle, educational level, and dietary confounders showed a direct association of WC (quartile distribution) and BMI categories with ox-LDL (P for linear trend = 0.002) and CRP (P for linear trend = 0.004). Subjects in the top quartile of WC and with a BMI > 29.9 were at high risk of elevated circulating concentrations of ox-LDL and CRP. Further adjustment for cardiovascular disease risk factors did not substantially modify these associations…High WC was associated with high concentrations of ox-LDL independently of BMI in the study population.” |
|
|
|
|
|
A study of 18 members of the Caloric Restriction Society (of which I am a member) found a that CR appears to reduce risk factors for atherosclerosis better than any medicine. The main caveat is that the subjects are "health nuts" - they not only reduce calorie intake but also eat lots of veggies, nuts, vitamins; they exercise moderately and cut down on meat, etc. |
||
|
|
Longer period of obesity => worse HTN & metabolic problems |
“The duration of overweight has a significant effect on obesity-related comorbidities in men and women.” |
|
|
|
Miscellany |
Fewer OR mistakes on thin people |
"Patients with retained foreign bodies also had a higher mean body-mass index ... In multivariate analysis, factors associated with a significantly increased risk of retention of a foreign body were ... body-mass index (risk ratio for each one-unit increment, 1.1)." |
|
|
|
|
Reduced risk in auto accidents |
“Increased body weight was associated with increased risk of mortality and increased risk of severe injury. The odds ratio for death was 1.013 (95% CI: 1.007, 1.018) for each kilogram increase in body weight.” |
|
|
|
|
Reduced risk of death after serious injury |
“Two hundred forty-two consecutive patients admitted to the intensive care unit following blunt trauma. Patients were divided into 2 groups by body mass index. The obese group was defined as having a body mass index of 30 kg/m2 or higher, and the nonobese group was defined as having a body mass index lower than 30 kg/m2…Obesity was an independent predictor of mortality with an adjusted odds ratio of 5.7” |
|
|
|
|
Increased fertility in men and women |
“Overweight men have reduced fertility due to increased fragmentation of DNA in their sperm… Men with high BMI … have lower sperm motility, which may compound fertility problems…Obesity has also been shown to have a negative effect on women's fertility. A high BMI gives a greater risk of polycystic ovary syndrome and insulin resistance, both linked to poor IVF outcomes.” |
|
|
|
|
Preservation of immune function |
“The results of this study provide support for the hypothesis that moderate caloric restriction in humans may have a beneficial effect on cell-mediated immunity…” |
|
|
|
|
Works in concert with exercise, but CR is more important than exercise! |
“We examined the associations of the body-mass index and physical activity with death among 116,564 women who, in 1976, were 30 to 55 years of age and free of known cardiovascular disease and cancer. RESULTS: During 24 years of follow-up, 10,282 deaths occurred--2370 from cardiovascular disease, 5223 from cancer, and 2689 from other causes. Mortality rates increased monotonically with higher body-mass-index values among women who had never smoked (P for trend <0.001). In combined analyses of all participants, adiposity predicted a higher risk of death regardless of the level of physical activity… Even modest weight gain during adulthood, independent of physical activity, was associated with a higher risk of death. We estimate that excess weight (defined as a body-mass index of 25 or higher) and physical inactivity (less than 3.5 hours of exercise per week) together could account for 31 percent of all premature deaths, 59 percent of deaths from cardiovascular disease, and 21 percent of deaths from cancer among nonsmoking women.” |
|
Miscellany
|
Category |
|
|
Ref |
Fig |
|
Review of CR |
CR works |
Thorough review of human and animal data, free full text |
|
|
|
|
|
Large review of CR, free full text. One interesting point: exercise may not increase life span. |
|
|
|
|
|
Other reviews of CR |
|
|
|
PubMed CR search |
|
On 2006-08-30 I found 4116 references to “calori* restrict*” A search on Google for caloric restriction yields about 2 million results |
|
|
|
Books on CR |
|
Extensive reviews and summaries of CR. Because they are books they have the advantage of being synoptic but the disadvantage of always being a few years out of date. |
|
|
|
Web articles on CR |
Research |
|
|
|
|
|
|
Christiaan Leeuwenburgh, PhD is a researcher in aging at the University of Florida. These links are to beautifully illustrated lecture slides in PDF format, including lots on the biology of aging, caloric restriction, etc. |
|
|
|
|
CR benefits |
Heat tolerance
From a CR Society message by Khurram Hashami (2004-06-13): - Fewer colds/flus - Fewer headaches - Fewer aches/pains, in general - Fewer hemorrhoids - Improved complexion - An hour or two gained due to req. of less sleep - Mental clarity + focus - Sensory-input resolution improvements: auditory, olfactory, etc - Improved mental health (less emotional swings, noise, clutter) - Greater energy and stamina |
|
|
|
|
Side effects |
Cold intolerance, decreased libido, cosmetic (people ask why you look thin), possible osteoporosis, possible low blood count |
|
|
|
|
CR Society |
The web site of the Calorie Restriction Society, of which I have been a member for about five years. |
|
|
|
|
FAQ |
A list of FAQs on the net |
|
|
|
|
Popular press articles on CR |
|
|
|
|
|
AOR article on CRON |
An outstanding 35+ page PDF summary, from AOR (Advanced Orthomolecular Research), a Canadian supplement company where Michael Rae (the likely author) works. Here are some GREAT quotes, all based on data:
“The road to aging is paved with calories.”
“The added years [from CRON] are healthy ones.”
“CRON animals maintain more youthful strength and agility”
“CRON clearly preserves the brain itself with age”, with “more youthful mental function”
“For every proposed mechanism of aging, there is evidence that CRON steps in to check the process in question.” [with experimental data references showing that CRON results in reduction of free radicals, AGEs, DNA errors, DNA methylation problems, hormone feedback loops]
“A well-designed CRON program, like a carefully tailored drug prescription, finds the lowest possible dose (calories) of the drug (food) required to maximize its benefits (nutrients) whiled minimizing its side-effects (aging caused by the metabolism of calories).”
http://www.aor.ca/mags/Truth-to-the-fountain-of-youth-2003_Spring.pdf |
|
|
|
|
Discovery Channel on CR |
An 8-minute video about CR from 2004-01, fairly accurate if limited: http://www.exn.ca/news/video/exn2004/01/27/exn20040127-calories.asx |
|
|
|
|
Video from CRIII |
David Stern describes his experience with CR. It led him to lose weight, get off blood pressure and cholesterol medications, but with better BP and cholesterol than every before, etc. This is, in fact, a pretty universal response to CR. |
|
|
|
Optimal nutrition |
Protein etc |
Studies show longer life span in rodents given relatively high protein diets |
|
|
|
How to do CR |
My summary |
CR is simply eating less, with good nutrition. This is quite simple, but our desires and lack of self-control get in the way. Therefore, almost everyone needs to learn habits and use psychological helps to avoid overeating. The ones I know of that have been demonstrated to work are listed below. |
|
|
|
|
Take smaller portions |
“Subjects consumed 30% more energy (676 kJ) when offered the largest portion than when offered the smallest portion.” |
|
|
|
|
|
“We investigated whether environmental cues such as packaging and container size are so powerful that they can increase our intake of foods that are less palatable. DESIGN, SETTING, AND PARTICIPANTS: In a 2 x 2 between-subjects design, 158 moviegoers in Philadelphia (57.6% male; 28.7 years) were randomly given a medium (120 g) or a large (240 g) container of free popcorn that was either fresh or stale (14 days old). Following the movie, consumption measures were taken, along with measures of perceived taste. OUTCOME MEASURES AND RESULTS: Moviegoers who were given fresh popcorn ate 45.3% more popcorn when it was given to them in large containers. This container-size influence is so powerful that even when the popcorn was disliked, people still ate 33.6% more popcorn when eating from a large container than from a medium-size container. CONCLUSIONS AND IMPLICATIONS: Even when foods are not palatable, large packages and containers can lead to overeating. The silver lining of these findings may be that portion size can also be used to increase the consumption of less preferred healthful foods, such as raw vegetables.” |
|
|
|
|
|
“Doubling an age-appropriate portion of an entree increased entree and total energy intakes at lunch by 25% and 15%, respectively. Changes were attributable to increases in the average size of the children's bites of the entree without compensatory decreases in the intake of other foods served at the meal. These increases were seen even though observational data indicated that the children were largely unaware of changes in portion size. Greater responsiveness to portion size was associated with higher levels of overeating. The children consumed 25% less of the entree when allowed to serve themselves than when served a large entree portion. CONCLUSIONS: Large entree portions may constitute an "obesigenic" environmental influence for preschool-aged children by producing excessive intake at meals.” |
|
|
|
|
|
“Increases in portion size and energy density led to independent and additive increases in energy intake (P <0.0001). Subjects consumed 56% more energy (925 kJ) when served the largest portion of the higher energy-dense entree than when served the smallest portion of the lower energy-dense entree.” |
|
|
|
|
|
“Increasing portion size, eating away from home, and consuming a variety of high-energy dense foods appear to increase energy intake.” … “Reducing saturated fat, simple sugars, and other refined and processed foods without replacement of calories should lead to decreased energy intake. Including generous amounts of low-energy-dense vegetables and fruits (not juice or dried fruit), and moderate amounts of whole-grain, low-glycemic-index carbohydrates should also help to reduce total energy intake. In fact, a healthy dietary pattern such as this is associated with lower weight gain” |
|
|
|
|
|
“BACKGROUND: When the portion size and energy density (in kcal/g) of a food are varied simultaneously in a single meal, each influences energy intake independently. ... DESIGN: In a crossover design, 24 young women were provided with meals and snacks for 2 consecutive days per week for 4 wk; all foods were consumed ad libitum. Across the 4 sessions, the subjects were served the same 2 daily menus, but all foods were varied in portion size and energy density between a standard level (100%) and a reduced level (75%). RESULTS: Reducing the portion size and energy density of all foods led to significant and independent decreases in energy intake over 2 d (P < 0.0001). A 25% decrease in portion size led to a 10% decrease in energy intake (231 kcal/d), and a 25% decrease in energy density led to a 24% decrease in energy intake (575 kcal/d). The effects on energy intake were additive and were sustained from meal to meal. Despite the large variation in energy intake, there were no significant differences in the ratings of hunger and fullness” |
|
|
|
|
Use small plates, bowls and utensils |
“The 2 x 2 between-subjects design involved 85 nutrition experts who were attending an ice cream social to celebrate the success of a colleague in 2002. They were randomly given either a smaller (17 oz) or a larger (34 oz) bowl and either a smaller (2 oz) or larger (3 oz) ice cream scoop. After serving themselves, they completed a brief survey as their ice cream was weighed. The analysis was conducted in 2003. RESULTS: Even when nutrition experts were given a larger bowl, they served themselves 31.0% more (6.25 vs 4.77 oz…) without being aware of it. Their servings increased by 14.5% when they were given a larger serving spoon (5.77 vs 5.04 oz, F(1, 80)=2.70, p =0.10). CONCLUSIONS: People could try using the size of their bowls and possibly serving spoons to help them better control how much they consume. Those interested in losing weight should use smaller bowls and spoons” |
|
|
|
|
Do not snack |
Snacks do NOT help fill you up or reduce the amount eaten at subsequent meals. |
|
|
|
|
Avoid tasty foods |
In an animal model of caloric restriction in rats, “Just a morsel of palatable food could precipitate binge eating of a food that is otherwise not overeaten.” Based on my own experience I think this is true in humans too. |
|
|
|
|
Avoid a wide variety of foods at meals |
“…one study found that greater variety in almost every food category leads to increased calorie consumption. The only exception is vegetables. More variety of this food lowers calorie intake.” |
|
|
|
|
Eat breakfast, avoid heavy suppers, eat low energy density food |
“The proportion of intake in the morning was negatively correlated with overall intake (r = -0.13, P < 0.01), whereas the proportion ingested late in the evening was positively correlated with overall intake (r = 0.14, P < 0.01). The energy densities of intake during all periods of the day were positively related to overall intake (range, r = 0.13-0.23, P < 0.01). The results suggest that low energy density intake during any portion of the day can reduce overall intake, that intake in the morning is particularly satiating and can reduce the total amount ingested for the day, and that intake in the late night lacks satiating value and can result in greater overall daily intake.” |
|
|
|
|
|
“In a randomized crossover trial, …[omitting breakfast] impairs fasting lipids and postprandial insulin sensitivity and could lead to weight gain if the observed higher energy intake was sustained. “ |
|
|
|
|
High protein diet |
“An increase in dietary protein from 15% to 30% of energy at a constant carbohydrate intake produces a sustained decrease in ad libitum caloric intake” |
|
|
|
|
Other |
I
have found several simple things that help me personally: -
Avoid eating after supper -
Avoid the temptation to eat more just because that food is
good for you (e.g., nuts) - Avoid salty foods & carbohydrates:
these increase appetite |
|
|
|
|
|
Maintaining weight loss becomes easier over time. |
|
|
|
|
Add fiber |
Fiber was shown in a randomized controlled study to reduce hunger and constipation in those given a very low calorie diet. |
|
|
|
|
|
An 8-year, prospective study of 27082 middle-aged men showed that both whole-grain foods and bran tended to reduce weight gain, by 0.49 kg per 40 g/day whole grains, and by 0.36 kg per 20 g/day bran intake. |
|
|
|
|
Increase calcium from dairy sources
… but maybe NOT |
“…low calcium diets impede body fat loss, while high calcium diets markedly accelerate fat loss in transgenic mice subjected to caloric restriction. These findings are further supported by clinical and epidemiological data demonstrating a profound reduction in the odds of being obese associated with increasing dietary calcium intake. Notably, dairy sources of calcium exert a significantly greater anti-obesity effect than supplemental sources in each of these studies”
“The purpose of this study was to compare weight and body fat loss on a calorie-restricted, low-dairy (CR) vs. high-dairy (CR+D) diet. … a high-dairy calcium diet does not substantially improve weight loss beyond what can be achieved in a behavioral intervention.” |
|
|
|
|
(For women): Eat a low-Glycemic Index diet |
“A prospective cohort study was conducted in a subsample of men and women from the Danish arm of the Monitoring Trends and Determinants in Cardiovascular Disease study. The subsample comprised 185 men and 191 women born in 1922, 1932, 1942, or 1952. A baseline health examination and a dietary history interview were carried out in 1987 and 1988; a follow-up health examination was performed in 1993 and 1994. RESULTS: Positive associations between GI and changes in body weight (DeltaBW), percentage body fat (Delta%BF), and waist circumference (DeltaWC) were observed in women after adjustment for covariates. Significant GI x sex x physical activity interactions for DeltaBW, Delta%BF, and DeltaWC were observed, and the associations in the sedentary women were particularly positive. No significant associations with GI were observed in men, and no significant associations with GL were observed in either sex. CONCLUSIONS: High-GI diets may lead to increases in BW, body fat mass, and WC in women, especially in sedentary women, which suggests that physical activity may protect against diet-induced weight gain. No associations with GI were observed in men, which suggests sex differences in the association between GI and obesity development.” |
|
|
|
|
Mediterranean diet |
May help people avoid gaining too much weight. “High [Mediterranean diet] adherence was associated with significantly lower likelihood of becoming obese among overweight subjects, with stronger associations after adjusting for underreporting of dietary data. Associations (odds ratios with 95% CI) were similar in women (0.69, 0.54–0.89) and men (0.68, 0.53–0.89).” |
|
|
|
|
Eat low-energy-density foods (veggies etc.) |
“The present study examined the relation of energy density to dietary intake and body size in 371 male and 581 female adults. The subjects were free-living … High energy density was associated with greater (P < 0.001) total intake, especially of fat”. In other words, those who ate rich foods ended up eating more. |
|
|
|
|
Eat a low-carb diet with MUFAs |
“Weight loss was significantly greater in the [protein and monounsaturated fat low-carbohydrate group] (13.6 lb) than in the [replacement of saturated fat with carbohydrates] group (7.5 lb), a difference of 6.1 lb” |
|
|
|
|
|
“A randomized parallel-design study of 39 overweight or obese young adults aged 18 to 40 years who received an energy-restricted diet, either low-glycemic load or low-fat…Participants receiving the low-glycemic load diet reported less hunger than those receiving the low-fat diet (P = .04). Insulin resistance (P = .01), serum triglycerides (P = .01), C-reactive protein (P = .03), and blood pressure (P = .07 for both systolic and diastolic) improved more with the low-glycemic load diet.” |
|
|
|
|
Diet types |
This is a reference to a well-thought-out summary of three popular diet types by the USDA, with good references and documentation: 1. Atkins 2. Food pyramid, DASH, Weight Watchers 3. Ornish, Pritikin Please note, I do NOT advocate the Atkins diet: I think it advocates far too much consumption of meat and animal fat. You may lose weight but at the expense of cardiovascular disease and cancer. |
|
|
|
|
Take green tea extract supplements |
“After a 2-wk diet run-in period, healthy Japanese men were divided into 2 groups with similar BMI and waist circumference distributions. A 12-wk double-blind study was performed in which the subjects ingested 1 bottle oolong tea/d containing 690 mg catechins (green tea extract group; n = 17) or 1 bottle oolong tea/d containing 22 mg catechins (control group; n = 18). Results: Body weight, BMI, waist circumference, body fat mass, and subcutaneous fat area were significantly lower in the green tea extract group than in the control group.” |
|
|
|
|
Children and pregnant women should be relatively thin. |
“The incidence rose with increasing body size at birth. From birth the mean weight and BMI of people who later became obese exceeded the average and remained above average at a statistically significant level at all ages from 6 months to 12 y. Childhood BMI was a stronger predictor of adult obesity than body size at birth. A higher maternal BMI in pregnancy was associated with a more rapid childhood growth and an increased risk of becoming obese in adult life.” |
|
|
|
|
Eat raw food |
“In a cross-sectional study 216 men and 297 women consuming long-term raw food diets (3.7 years; SE 0.25) of different intensities completed a specially developed questionnaire. Participants were divided into 5 groups according to the amount of raw food in their diet (70-79, 80-89, 90-94, 95-99 and 100%). A multiple linear regression model (n = 513) was used to evaluate the relationship between body weight and the amount of raw food consumed. Odds of underweight were determined by a multinomial logit model. RESULTS: From the beginning of the dietary regimen an average weight loss of 9.9 kg (SE 0.4) for men and 12 kg (SE 0.6) for women was observed. Body mass index (BMI) was below the normal weight range (<18.5 kg/m(2)) in 14.7% of male and 25.0% of female subjects and was negatively related to the amount of raw food consumed and the duration of the raw food diet.” |
|
|
|
|
Vegan diet |
“Adoption of a low-fat, vegan diet was associated with significant weight loss in overweight postmenopausal women, despite the absence of prescribed limits on portion size or energy intake.” |
|
|
|
|
Eat foods that are not too tasty |
“All reviewed studies have shown increased intake as palatability increased… Studies have shown that increasing the food variety can increase food and energy intake and in the short to medium term alter energy balance.” |
|
|
|
|
Weigh yourself each day |
This randomized study of people showed that those who were in the group that weighed themselves regularly and checked in weekly with a counselor kept weight off better than other groups that did not do so. |
|
|
|
|
|
“We randomly assigned 314 participants who had lost a mean of 19.3 kg of body weight in the previous 2 years to one of three groups: a control group, which received quarterly newsletters (105 participants), a group that received face-to-face intervention (105), and a group that received Internet-based intervention (104). The content of the programs in the two intervention groups was the same, emphasizing daily self-weighing and self-regulation, as was the frequency of contact with the groups. The primary outcome was weight gain over a period of 18 months. RESULTS: The mean (+/-SD) weight gain was 2.5+/-6.7 kg in the face-to-face group, 4.7+/-8.6 kg in the Internet group, and 4.9+/-6.5 kg in the control group… Daily self-weighing increased in both intervention groups and was associated with a decreased risk of regaining 2.3 kg or more (P<0.001).” |
|
|
|
|
Keep high personal standards |
“Forty-one healthy women were randomly assigned either to a high personal standards condition (n=18) or to a low personal standards condition for 24h (n=23)… participants in the high personal standards condition ate fewer high calorie foods, made more attempts to restrict the overall amount of food eaten, and had significantly more regret after eating than those in the low personal standards condition.” |
|
|
|
Problems with CR: binge eating |
|
Dieting itself tends to have some fairly consistent psychological effects such as binge eating. This is not a response to dieting, but rather happens on the knowledge that dieting is to come! This kind of thing occurs even in lab rats. N.b., Although I do not know much about it, I understand that people with anorexia nervosa diet for cosmetic reasons, and that the health problems are from malnutrition and from the metabolic imbalance due to bulimia (binge eating followed by self-induced vomiting and/or laxative use). |
|
|
|
Genetics |
Affects obesity tendency |
"Based on studies of twins, scientists estimate that 40 to 60 percent of susceptibility to obesity is attributable to genes." |
|
|
|
Quotes |
Luigi Cornaro (1464-1566) |
Luigi Cornaro (see Wikipedia) lived for perhaps 102 years, after starting a CR diet at age 40. “…as the natural force and heat lessen as a man grows in years, he should diminish the quantity of his food and drink, as nature at that period is content with little” |
|
|
|
|
Socrates |
He said that most people live to eat but that he ate to live |
|
|
|
|
Jonathan Swift |
“Every one desires to live long, but no one would be old.” (1667-1745) Thoughts on Various Subjects, Moral and Diverting |
1 |
|
|
|
Benjamin Franklin |
“To lengthen thy life, lessen thy meals.” Poor Richard's Almanack, June 1733 "I guess I don't so much mind being old, as I mind being fat and old." |
2
|
|
|
|
Disney’s “Mickey and the Beanstalk” |
There is one inadvertently relevant song in that says “… I’m gonna eat and eat and eat and eat and eat until I die.” Unfortunately, this is true for human nature. |
|
|
|
|
Tom Stoppard |
“I think age is a very high price to pay for maturity.” |
|
|
|
|
Woody Allen |
"Some people want to achieve immortality through their works or their descendants. I prefer to achieve immortality by not dying." |
|
|
|
Summary of the anti-aging effects of CR |
The (US) President’s Council on Bioethics |
“What is clear, however, from numerous studies in both invertebrates and vertebrates (including mammals), is that a reduction of food intake to about 60 percent of normal has a significant impact not only on lifespan, but on the rate of decline of the animal’s neurological activity, muscle functions, immune response and nearly every other measurable marker of aging. … studies in mice and rats suggest that caloric restriction appears to result in significantly increased rates of spontaneous activity, including the ability to run greater distances and to maintain a “youthful” level of activity at an age well beyond that of non-restricted animals of the same species.” |
|
|
|
BMI |
Calculation |
Calculator & tables. Note: a BMI of 18.5 is the lower end of normal on this US Government web site. |
Table 2 |
|
|
|
Tables of standard weights |
Life insurance Based on sex, height, and frame. |
|
|
|
|
Standards for children, by age |
Charts for each sex, from the US Federal Government’s Centers for Disease Control and Prevention (CDC) |
|
|
|
|
BMI correlates with attractiveness |
In a “40 male undergraduate men rated color images of 50 women in frontal view. Statistical analysis was done. RESULTS: BMI was much more significant than Waist to Hip ratio, for determining attractiveness.” – see the graph. The peak attractiveness was a BMI of about 17-20. See the graph. [Another study recently confirmed this finding.] This makes sense: fashion models typically have a BMI of about 17. |
|
|
|
|
Bibliography |
An interesting list of references to significant BMI articles is at http://www.halls.md/bmi/bibliography.htm. |
|
|
|
Calorie requirements |
Harris Benedict formula |
Based on the Harris-Benedict formula for a man of my height (5' 9.5") and age (43 yr), I calculated that my “basal energy expenditure” at 158 lb would be 2296 calories/day (BMI = 23). If I cut back on calories by 25% to 1722 calories/day, my resulting stable weight by this formula would be 117 lb (BMI = 17), a drop in weight of 26%. In other words, this formula predicts that for practical purposes weight and caloric intake are directly proportional, at least for men in this age and weight range. (Based on other calculations, I think this amount of CR gives a likely extension of life span from 78 yr to between 82 and 85 yr.) |
|
|
|
CR side effect |
Lower body temperature |
Demonstrated in lab animals. In people on CR, body temperature seems to be about 0.5 degree C lower on average. People on CR (including me) report lower tolerance to cold and much greater heat tolerance. |
|
|
|
|
Decreased libido |
But remember, there is no libido in the grave. |
|
|
|
Social, political and environmental effects if there were widespread adoption of 25% CR by all people at adolescence |
My own estimates, based extrapolation from available research |
Later onset of mental impairment (6 yr = 11% of useful years): Much longer useful & productive years of work, tremendous increase in the value of wisdom that comes with age and experience (it would not be countered by mental decline!). Later onset of disease (by about 7 yr): Prolonged useful years of work, prolonged happy years, later age at retirement, increase in the fractional proportion of life spent in productive work (instead of time spent in education and retirement). Lesser incidence of disease: (However, I am not sure if this is a separate effect from later onset of disease as noted above.) Lesser need for medical care (doctors and other health care personnel, hospitals, drugs, medical-related training, research), less disability Lower body temperature and greater heat tolerance: Lesser need for air conditioning (think lower bills and less energy used), increased need for heat in the winter and/or warm clothing. Tremendous positive environmental effects (perhaps by 20%) From all of these things: including lesser effects from war and defense spending, less pollution from farms, less fuel spent on transportation. Decreased body weight and width (by 25%): Fuel efficiency, smaller clothing, narrower seats, profound changes in transportation design, less wear and tear on cars and roadways, lesser injuries from accidents, smaller military ships and planes. Interestingly, this effect was found in a US government study: “Through the 1990s, the average weight of Americans increased by 10 pounds, according to the Centers for Disease Control and Prevention. The extra weight caused airlines to spend $275 million to burn 350 million more gallons of fuel in 2000 just to carry the additional weight of Americans, the federal agency estimated in a recent issue of the American Journal of Preventive Medicine.” Smaller meals (by 25%): Smaller refrigerators, smaller pantries, smaller kitchens and kitchen pots, shorter time spent at restaurants with resulting efficiencies. Less food eaten (by 25%): More food and farm resources available to feed a hungry world, smaller grocery stores, less environmental effects. Lower levels of testosterone in men: Less aggression – perhaps less war and fewer crimes, increased rate of bone problems in older age (exacerbated by the small body habitus), perhaps fewer children, perhaps a lower rate of divorce. Longer life (by 10 yr = 13%): An initial increase in world population, but studies of developing countries demonstrate that families feel less need to have many children when the rate of death is less (thus the population decline in Europe) Greater productivity from less time wasted on eating food: Simply think of the time saved by skipping lunch.
I think that the total benefits to society of CR would be somewhat multiplicative, not just additive. The few negatives (perhaps more bone fractures in old age) would be completely overwhelmed by the many positives. There would be much more productivity (generated money) that would not be wasted on medical care and super-sized food and clothing. The sum total might be incredible, perhaps doubling or tripling the world productivity. I think the prolonged mental astuteness is perhaps the most profound of all of these effects: think of the results of increased creativeness and inventiveness!
CR should be thought of as a major weapon system by the military. CR should be a high priority of government. CR should be major emphasis of health care organizations. |
|
|
|
|
High BMI => more gasoline used in US! |
“This article quantifies the amount of additional fuel consumed (annually) in the United States by automobiles that is attributable to higher average passenger (driver and non-driver) weights, during the period from 1960 to 2002. The analysis uses existing driving data in conjunction with historical weight data. The results indicate that, since 1988, no less than 272 million additional gallons of fuel are consumed annually due to average passenger weight increases. This number grows to approximately 938 million gallons of fuel when measured from 1960, which corresponds to approximately 0.7% of the nation's annual fuel consumption, or almost three days of fuel consumption by automobiles. Moreover, more than 39 million gallons of fuel are estimated to be used annually for each additional pound of average passenger weight.” |
|
|
|
The cost of obesity |
The higher your BMI, the higher your medical costs |
“Obese patients had more hospitalizations (P<.001), prescription drugs (P<.001), professional claims (P<.001), and outpatient visits (P = .005). Obese patients used more cardiovascular, intranasal allergic rhinitis, asthma, ulcer, diabetes, thyroid, and analgesic drugs. Total costs between groups [obese vs. nonobese] were different (median of $585.44 for obese and $333.24 for nonobese patients; P<.001). Cost differences were primarily due to medications (P<.001). Predictors of total costs were age, sex, BMI, and [chronic disease score]. For each unit BMI increase, costs increased 2.3% (P<.001).” |
|
|
|
US weight trends |
Increasing rate of obesity |
According to the CDC surveys conducted in 1977-1978 and 1994-1996, reported daily caloric intakes increased from 2239 to 2455 in men and from 1534 to 1646 in women. A BMI of 25-30 is considered “overweight”, and >30 is “obese”. By these criteria, in 2000 65% of Americans were overweight and 31% were obese, an increase of about 20% from a survey in 1988-1994; even the rate of obesity in children has increased by 50% in the last 20 years. This correlates well with my own observations of people. In fact this is a world-wide trend, probably part of human nature. |
|
|
|
Summary |
NIH lecture video |
By Dr Lane: http://videocast.nih.gov/ram/gls071301.ram |
|
|
|
|
Radio broadcast on the Net |
KQED is the National Public Radio (NPR) affiliate in San Francisco. On Tue, September 16, 2003, the program “Forum” did a segment on Aging Research, with Cynthia Kenyon, David Sinclair, Dale Bredesen, and a journalist named Philip Cohen. The audio stream can be found here: http://www.kqed.org/programs/program-archive.jsp?progID=RD19&ResultStart=1&ResultCount=10&type=radio |
|
|
|
|
AOR summary |
A very good, 35+ page PDF summary of the beneficial effects of CR, along with current research in anti-aging medicine, with lots of references. From the Canadian supplement company, Advanced Orthomolecular Research (where Michael Rae works). http://www.aor.ca/mags/Truth-to-the-fountain-of-youth-2003_Spring.pdf |
|
|
|
Mechanism |
Progressive mitochondria DNA defects |
A study in Nature (May 27, 2004) found a CAUSATIVE link between progressively increasing mitochondria DNA defects and aging. The authors engineered a mouse with a defective mitochondria DNA polymerase. Over time, the mitochondria in the mice had increasing defects: “This increase in somatic mtDNA mutations is associated with reduced lifespan and premature onset of ageing-related phenotypes such as weight loss, reduced subcutaneous fat, alopecia (hair loss), kyphosis (curvature of the spine), osteoporosis, anaemia, reduced fertility and heart enlargement. Our results thus provide a causative link between mtDNA mutations and ageing phenotypes in mammals.” These same progressive mitochondria defects occur with age in normal mice and men, and are directly related to caloric intake. As I understand it, the calories are “burned” in the mitochondria => free radical damage to the mitochondria inner membrane & mtDNA. Common antioxidants such as vitamin E do not affect this process. |
|
|
|
|
Mitochondria DNA defects from ROS |
“It is suggested that a low rate of mitochondrial ROS generation extends lifespan both in long-lived and in caloric-restricted animals by determining the rate of oxidative attack and accumulation of somatic mutations in mitochondrial DNA.” |
|
|
|
|
Mediated through the effects of insulin? |
“caloric restriction decreases the mitochondrial proton motive force by increasing the mitochondrial proton leak and that this leak is dependent, at least in part, on plasma insulin levels.” “It was hypothesized that [the effects of CR] may be due to upstream changes in hormonal status, since certain hormones (such as insulin) are stimulatory for ROS production, effect fatty acid composition, and are lowered by CR. To investigate this hypothesis, young male Brown-Norway rats on 55% CR (4 months duration) were subjected to insulin replacement by use of mini-osmotic pumps. ROS and free radical-induced malondialdehdye production were significantly lower in mitochondria from CR animals compared to those from fully fed, and these effects were reversed by insulin. It is concluded that the beneficial changes induced by CR, as seen at the mitochondrion, may in part be downstream effects of alterations in hormonal signalling.” |
|
|
|
|
|
“Therefore, decreasing the food intake may, from a toxicological point of view, mean a reduction of the cumulative exposure to many toxic compounds present in our diet and produced from it. It may decrease the energy expenditure for the detoxification processes allowing for its allocation in other vital processes. This effect can make also a significant contribution to the beneficial effects of CR.” |
|
|
|
Make sure your nutrition is adequate |
CR mice live longer with optimal diet |
Six groups of mice were studied with variations in diet quality (standard diet vs. enriched for protein, vitamins and minerals) and % CR. The CR mice survived longer than the ad lib mice; the CR + optimal diet survived longest of all and were healthiest. |
|
|
|
Rats |
CR => lower organ mass304 |
38% CR results in the following organ mass change in rats: Organ Percent reduction
Total body weight 42
Brain 0
Testes 6
Prostate 25
Heart 29
Liver 34
Kidney 33
Spleen 50
Muscle 40
Body fat 70
|
|
|
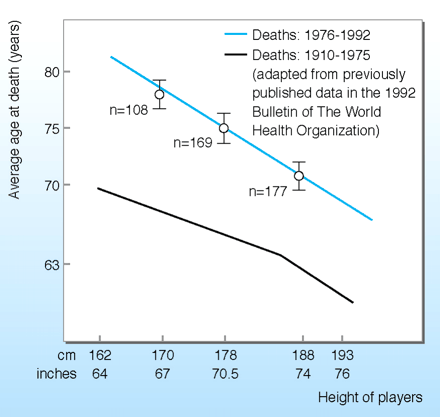
Figure 5: Short people live longer64
By my calculations based on basal energy expenditure, a man with a height of 64" and a BMI of 23 would eat approx 1938 calories (at age 40) to keep up his weight. A man 20 cm (8") taller would eat 2467 calories. The smaller man is “effectively 21% calorie restricted.” From the rodent model, a 21% life-long calorie restriction would result in 13 yr of life extension. The height vs. lifespan graphs above support the hypothesis that increased calorie intake alone is the cause of a smaller lifespan for tall men.
|
BMI => |
14 |
16 |
17 |
18 |
19 |
20 |
21 |
23 |
25 |
28 |
30 |
35 |
40 |
|
Height (inches) |
Weight (lb.)
|
||||||||||||
|
58 |
67 |
77 |
81 |
86 |
91 |
96 |
100 |
110 |
120 |
134 |
144 |
167 |
191 |
|
59 |
69 |
79 |
84 |
89 |
94 |
99 |
104 |
114 |
124 |
139 |
149 |
173 |
198 |
|
60 |
72 |
82 |
87 |
92 |
97 |
102 |
108 |
118 |
128 |
143 |
154 |
179 |
205 |
|
61 |
74 |
85 |
90 |
95 |
101 |
106 |
111 |
122 |
132 |
148 |
159 |
185 |
212 |
|
62 |
77 |
87 |
93 |
98 |
104 |
109 |
115 |
126 |
137 |
153 |
164 |
191 |
219 |
|
63 |
79 |
90 |
96 |
102 |
107 |
113 |
119 |
130 |
141 |
158 |
169 |
198 |
226 |
|
64 |
82 |
93 |
99 |
105 |
111 |
117 |
122 |
134 |
146 |
163 |
175 |
204 |
233 |
|
65 |
84 |
96 |
102 |
108 |
114 |
120 |
126 |
138 |
150 |
168 |
180 |
210 |
240 |
|
66 |
87 |
99 |
105 |
112 |
118 |
124 |
130 |
143 |
155 |
173 |
186 |
217 |
248 |
|
67 |
89 |
102 |
109 |
115 |
121 |
128 |
134 |
147 |
160 |
179 |
192 |
223 |
255 |
|
68 |
92 |
105 |
112 |
118 |
125 |
132 |
138 |
151 |
164 |
184 |
197 |
230 |
263 |
|
69 |
95 |
108 |
115 |
122 |
129 |
135 |
142 |
156 |
169 |
190 |
203 |
237 |
271 |
|
70 |
98 |
112 |
118 |
125 |
132 |
139 |
146 |
160 |
174 |
195 |
209 |
244 |
279 |
|
71 |
100 |
115 |
122 |
129 |
136 |
143 |
151 |
165 |
179 |
201 |
215 |
251 |
287 |
|
72 |
103 |
118 |
125 |
133 |
140 |
147 |
155 |
170 |
184 |
206 |
221 |
258 |
295 |
|
106 |
121 |
129 |
136 |
144 |
152 |
159 |
174 |
189 |
212 |
227 |
265 |
303 |
|
|
74 |
109 |
125 |
132 |
140 |
148 |
156 |
164 |
179 |
195 |
218 |
234 |
273 |
312 |
|
75 |
112 |
128 |
136 |
144 |
152 |
160 |
168 |
184 |
200 |
224 |
240 |
280 |
320 |
|
76 |
115 |
131 |
140 |
148 |
156 |
164 |
173 |
189 |
205 |
230 |
246 |
288 |
329 |
|
77 |
118 |
135 |
143 |
152 |
160 |
169 |
177 |
194 |
211 |
236 |
253 |
295 |
337 |
|
78 |
121 |
138 |
147 |
156 |
164 |
173 |
182 |
199 |
216 |
242 |
260 |
303 |
346 |
Table 2: BMI
BMI < 13 Higher risk of death in severe anorexia nervosa (10% in 9 yr)305
BMI = 14-16 Typical for people with moderate anorexia nervosa or maximum caloric restriction
BMI = 16-18 Typical for people on long-term, moderate caloric restriction.306
BMI = 18.5-24.9 “Normal” according to the US Government307
BMI
= 22-24.9 Higher risk for chronic disease, even though officially in
“healthy weight range” 308
BMI
> 25 Overweight:
high risk for disease, increased risk of premature death
BMI > 30 Obese: extreme risk for disease, high risk of premature death
|
Animal |
Diet |
Lifespan |
Lifespan increase with CR |
|
Delphia longispina |
Normal feeding |
46 days |
|
|
|
Restricted diet |
60 days |
30% |
|
|
|
|
|
|
Rotifers |
At-will feeding |
34 days |
|
|
(note: an abstract says there is a 14% increase with CR) 309 |
Moderate restriction |
45.3 days |
31% |
|
|
Severe restriction |
54.7 days |
60% |
|
|
|
|
|
|
Bowl and doily spider 310 |
About 8 flies per week |
30 days |
|
|
|
5 flies per week |
99 days |
230% |
|
|
1-3 flies per week |
139 days |
363% |
|
|
|
|
|
|
Guppy |
Normal |
33 mo. |
|
|
|
CR |
46 mo. |
39% |
|
|
|
|
|
|
Laboratory rats (Wistar strain) |
At-will feeding |
133.1 days |
|
|
|
Restricted diet |
163.4 days |
23% |
|
|
|
|
|
|
Dogs (Purina study) 7 |
Ad lib diet |
11.2 yr. |
|
|
(Labrador retrievers) |
25% restricted diet |
13.0 yr. |
16% |
Table 2: Caloric restriction lengthens lifespan in a wide variety of animals
Controlled studies show restricting food intake in several species actually increases lifespan. This table summarizes the results of several separate studies311, 312 (plus the Purina study data).
Figure 5: High BMI => high rates of disease
One standard way to calculate how fat or thin you are is Body Mass Index (BMI). Here are two charts of BMI vs. disease risk; I think the charts speak for themselves.313
Figure 5
The two graphs below (deleted because of copyright issues) are from a rodent CR meta-analysis (a compilation of many studies). The graphs show that two CR factors are linearly related to lifespan: length of CR and degree of CR.314 I extended the results of this analysis to people: it works out to about 40 seconds per calorie. For every bowl of ice cream you eat, you are effectively two hours closer to death. N. b., this is a useful paradigm only, not a working theory; nonetheless, it is approximately correct in many of its implications. Most the effects of “aging” are probably due to a combination of time and calories.
The same graphs from http://www045.heronetwork.com/modules.php?name=Sections&op=viewarticle&artid=12 (link now out of date):
 It
is about the best evidence available to demonstrate the tremendous
benefits possible with CR.
It
is about the best evidence available to demonstrate the tremendous
benefits possible with CR.

See the web site
Figure 5: Caloric restriction helps to preserve the part of the brain involved with memory.
“In Alzheimer’s
disease, molecular reactions are thought to kill cells in the
hippocampus, a brain area important for memory. The images above show
what happens when researchers inject a toxin into the hippocampus of
rats that stirs up similar deadly reactions. They found that cells in
rats that ate a regular diet degenerated while cells in rats
that ate a calorie-restricted diet resisted the toxin. Notice the
difference in the amount of cells near the yellow arrow toward the
right of each image. Furthermore, the researchers found that the
unrestricted eaters suffered from severe learning and memory deficits
similar to Alzheimer’s patients, but the restricted rats showed
little or no deficits. This work and other studies in animals suggest
that caloric restriction may be able to protect the brain from some
aspects of brain disease.
Images
from Mark Mattson, PhD, National Institute on Aging, Baltimore, MD.”315
Figure 6: Attractiveness by BMI
When rated by young men, the optimal BMI in young women is very thin, peaking at 17-20, consistent with mild CR.316 The attractiveness declines on both sides of this peak, reaching half its maximum at BMIs of 15 on the low end and 27 on the high end.
|
Parameter |
CR |
Control |
P value |
|
Total cholesterol, mg/dl |
158 |
205 |
0.001 |
|
LDL-C, mg/dl |
86 |
127 |
0.001 |
|
HDL-C, mg/dl |
63 |
48 |
0.006 |
|
Total cholesterol/HDL-C ratio |
2.6 |
4.5 |
0.001 |
|
TG/HDL-C ratio |
0.8 |
3.5 |
0.001 |
|
TG, mg/dl |
48 |
147 |
0.001 |
|
Systolic BP, mm Hg |
99 |
129 |
0.001 |
|
Diastolic BP, mm Hg |
61 |
79 |
0.001 |
|
Fasting glucose, mg/dl |
81 |
95 |
0.001 |
|
Fasting insulin, mIU/ml |
1.4 |
5.1 |
0.001 |
|
Hs-CRP, μg/ml |
0.3 |
1.6 |
0.001 |
Figure 7: reduction in risk factors for atherosclerosis in a study of humans on caloric restriction.146
TG = triglycerides; BP = blood pressure; mm Hg = millimeters of mercury (pressure); CRP = C-reactive protein.
|
Relative Risk |
||||
|
BMI 30-34.9 |
BMI > 40 |
|||
|
Medical condition |
Men |
Women |
Men |
Women |
|
Diabetes type 2 |
10 |
7 |
11 |
20 |
|
Coronary heart disease |
16 |
13 |
14 |
19 |
|
High blood pressure |
49 |
48 |
65 |
63 |
|
Osteoarthritis |
5 |
10 |
10 |
17 |
|
Breast cancer |
|
1.6 |
|
1.7 |
|
Colon cancer |
1.5 |
1.3 |
1.8 |
1.4 |
|
Prostate cancer |
1.2 |
|
1.3 |
|
Figure 8. Relative risk of developing these problems w.r.t. a person with a normal BMI (18.5-24.9). Relative Risk (RR) is a multiplier: for example, men with a BMI of 30-34.9 have a RR of 10 for diabetes type 2, meaning a ten-fold increased risk compared to those of normal BMI.
Adapted from a Reuters report on http://www.msnbc.msn.com/id/5005175/ 2004-05-18.
“Rats!”317
A whole series of diet-related comics (and other) is at http://www.glasbergen.com/fit.html
References
3 Modified from Gruber RP, Kalamas AD. Measuring human age by estimating lifetime caloric consumption. Gerontology 2000 Jan-Feb;46(1):44-6; PMID: 11111228
4 Patterson RE, Frank LL, Kristal AR, White E. A comprehensive examination of health conditions associated with obesity in older adults. Am J Prev Med. 2004 Dec;27(5):385-90. PMID: 15556738
5 Influence of metabolic syndrome and general obesity on the risk of ischemic stroke. Stroke. 2006 Apr;37(4):1060-4. Epub 2006 Mar 2. PMID: 16514099
6 Gustafson D, Rothenberg E, Blennow K, Steen B, Skoog I. An 18-year follow-up of overweight and risk of Alzheimer disease. Arch Intern Med. 2003 Jul 14;163(13):1524-8. PMID: 12860573
7 Jood K, Jern C, Wilhelmsen L, Rosengren A. Body Mass Index in Mid-Life Is Associated With a First Stroke in Men. A Prospective Population Study Over 28 Years. Stroke. 2004 Oct 28; [Epub ahead of print] PMID: 15514172
8 Deschamps V, Astier X, Ferry M, Rainfray M, Emeriau JP, Barberger-Gateau P. Nutritional status of healthy elderly persons living in Dordogne, France, and relation with mortality and cognitive or functional decline. Eur J Clin Nutr. 2002 Apr;56(4):305-12. PMID: 11965506
9 Ghadirian P, Jain M, Ducic S, Shatenstein B, Morisset R. Nutritional factors in the aetiology of multiple sclerosis: a case-control study in Montreal, Canada. Int J Epidemiol. 1998 Oct;27(5):845-52. PMID: 9839742
10 The risk of preeclampsia rises with increasing prepregnancy body mass index. Ann Epidemiol. 2005 Aug;15(7):475-82. PMID: 16029839
11 Body-mass index and symptoms of gastroesophageal reflux in women. N Engl J Med. 2006 Jun 1;354(22):2340-8. PMID: 16738270
14 Smoking, body mass, and hot flashes in midlife women. Obstet Gynecol. 2003 Feb;101(2):264-72. PMID: 12576249
16 McCay CM, Crowell MF, Maynard LA. The effects of retarded growth upon the length of life span and upon the ultimate body size. Journal of Nutrition 1935; 10:63-79.
17 Flurkey K, Currer JM. Pitfalls of animal model systems in ageing research. Best Pract Res Clin Endocrinol Metab. 2004 Sep;18(3):407-21. PMID: 15261846
18 Harrison DE, Archer JR, Astle CM. Effects of food restriction on aging: separation of food intake and adiposity. Proc Natl Acad Sci U S A. 1984 Mar;81(6):1835-8. PMID: 6608731
19 http://sciencenews.org/20020511/fob2.asp,
Kealy RD, Lawler DE, Ballam JM, Mantz SL, Biery DN, Greeley EH, Lust G, Segre M, Smith GK, Stowe HD. Effects of diet restriction on life span and age-related changes in dogs. J Am Vet Med Assoc. 2002 May 1;220(9):1315-20. PMID: 11991408
20 Speakman JR, van Acker A, Harper EJ. Age-related changes in the metabolism and body composition of three dog breeds and their relationship to life expectancy. Aging Cell. 2003 Oct;2(5):265-75. PMID: 14570234
21 Pinney DO, Stephens DF, Pope LS. Lifetime effects of winter supplemental feed level and age at first parturition on range beef cows. J Anim Sci. 1972 Jun;34(6):1067-74. PMID: 5027302
22 Lane MA, Mattison J, Ingram DK, Roth GS. Caloric restriction and aging in primates: Relevance to humans and possible CR mimetics. Microsc Res Tech. 2002 Nov 15;59(4):335-8. PMID: 12424798; http://www.sciam.com/askexpert/medicine/medicine18.html
23 Bodkin NL, Alexander TM, Ortmeyer HK, Johnson E, Hansen BC. Mortality and Morbidity in Laboratory-maintained Rhesus Monkeys and Effects of Long-term Dietary Restriction. J Gerontol A Biol Sci Med Sci. 2003 Mar;58(3):B212-9. PMID: 12634286
24 Thomas D. Pugh, Terry D. Oberley and Richard Weindruch. Caloric Restriction but not Dehydroepiandrosterone Sulfate Increases Lifespan and Lifetime Cancer Incidence in Mice. Cancer Research 59, 1642-1648, April 1, 1999. PMID: 10197641
25 Dhahbi JM, Kim HJ, Mote PL, Beaver RJ, Spindler SR. Temporal linkage between the phenotypic and genomic responses to caloric restriction. Proc Natl Acad Sci U S A. 2004 Apr 13;101(15):5524-9. Epub 2004 Mar 25. PMID: 15044709
26 Wirth-Dzieciolowska E, Czuminska K. Longevity and aging of mice from lines divergently selected for body weight for over 90 generations. Biogerontology. 2000;1(2):171-8. PMID: 11707933
27 Weindruch R, Walford RL. Dietary restriction in mice beginning at 1 year of age: effect on life-span and spontaneous cancer incidence. Science. 1982 Mar 12;215(4538):1415-8. PMID: 7063854
28 Beauchene RE, Bales CW, Bragg CS, Hawkins ST, Mason RL. Effect of age of initiation of feed restriction on growth, body composition, and longevity of rats. J Gerontol. 1986 Jan;41(1):13-9. PMID: 3941250
29 Wang C, Weindruch R, Fernandez JR, Coffey CS, Patel P, Allison DB. Caloric restriction and body weight independently affect longevity in Wistar rats. Int J Obes Relat Metab Disord. 2004 Mar;28(3):357-62. PMID: 14724654
30 Fischer-Piette, E.: Sur la croissance et la longevite' de longevite' de Patella vulgata L. en fonction du millieu. J Conchyliologie, 83:303, 1939.
31 Counting calories in Drosophila diet restriction. Exp Gerontol. 2006 Nov 22; PMID: 17125951
32 Calorie restriction and late-onset calorie restriction extend lifespan but do not alter protein storage in female grasshoppers. Mech Ageing Dev. 2006 Dec;127(12):883-91. Epub 2006 Oct 17. PMID: 17049582
33 Duffy PH, Lewis SM, Mayhugh MA, Trotter RW, Thorn BT, Feuers RJ, Turturro A. The effects of different levels of dietary restriction on non-neoplastic diseases in male Sprague-Dawley rats. Aging Clin Exp Res. 2004 Feb;16(1):68-78. PMID: 15132295
34 Caloric restriction protects mitochondrial function with aging in skeletal and cardiac muscles. Rejuvenation Res. 2006 Summer;9(2):219-22. PMID: 16706647
35 Berrigan D, Perkins SN, Haines DC, Hursting SD. Adult-onset calorie restriction and fasting delay spontaneous tumorigenesis in p53-deficient mice. Carcinogenesis. 2002 May;23(5):817-22. PMID: 12016155
36 Mukherjee P, Sotnikov AV, Mangian HJ, Zhou JR, Visek WJ, Clinton SK. Energy intake and prostate tumor growth, angiogenesis, and vascular endothelial growth factor expression. J Natl Cancer Inst. 1999 Mar 17;91(6):512-23. PMID: 10088621
37 Dirx MJ, Zeegers MP, Dagnelie PC, Van Den Bogaard T, Van Den Brandt PA. Energy restriction and the risk of spontaneous mammary tumors in mice: A meta-analysis. Int J Cancer. 2003 Sep 20;106(5):766-70. PMID: 12866038
38 Kritchevsky D, Weber MM, Klurfeld DM. Dietary fat versus caloric content in initiation and promotion of 7,12-dimethylbenz(a)anthracene-induced mammary tumorigenesis in rats. Cancer Res. 1984 Aug;44(8):3174-7. PMID: 6430545
39 Lingelbach LB, Mitchell AE, Rucker RB, McDonald RB. Accumulation of advanced glycation endproducts in aging male Fischer 344 rats during long-term feeding of various dietary carbohydrates. J Nutr. 2000 May;130(5):1247-55. PMID: 10801926 Free full text
40 Sell DR, Lane MA, Obrenovich ME, Mattison JA, Handy A, Ingram DK, Cutler RG, Roth GS, Monnier VM. The effect of caloric restriction on glycation and glycoxidation in skin collagen of nonhuman primates. J Gerontol A Biol Sci Med Sci. 2003 Jun;58(6):508-16. PMID: 12807921
42 Larson BT, Lawler DF, Spitznagel EL Jr, Kealy RD. Improved glucose tolerance with lifetime diet restriction favorably affects disease and survival in dogs. J Nutr. 2003 Sep;133(9):2887-92. PMID: 12949383
43 Ageing Res Rev 2002 Jun;1(3):397-411; PMID: 12067594
44 Van Remmen H, Hamilton ML, Richardson A. Oxidative damage to DNA and aging. Exerc Sport Sci Rev. 2003 Jul;31(3):149-53. Review. PMID: 12882482
45 Chung HY, Kim HJ, Kim KW, Choi JS, Yu BP. Molecular inflammation hypothesis of aging based on the anti-aging mechanism of calorie restriction. Microsc Res Tech. 2002 Nov 15;59(4):264-72. PMID: 12424787
46 Stewart J, Mitchell J, Kalant N. The effects of life-long food restriction on spatial memory in young and aged Fischer 344 rats measured in the eight-arm radial and the Morris water mazes. Neurobiol Aging. 1989 Nov-Dec;10(6):669-75. PMID: 2628778
47 Kant GJ, Yen MH, D'Angelo PC, Brown AJ, Eggleston T. Maze performance: a direct comparison of food vs. water mazes. Pharmacol Biochem Behav. 1988 Oct;31(2):487-91. PMID: 2854267
48 Pitsikas N, Carli M, Fidecka S, Algeri S. Effect of life-long hypocaloric diet on age-related changes in motor and cognitive behavior in a rat population. Neurobiol Aging. 1990 Jul-Aug;11(4):417-23. PMID: 2381501
49 Calabrese V, Scapagnini G, Giuffrida Stella AM, Bates TE, Clark JB. Mitochondrial involvement in brain function and dysfunction: relevance to aging, neurodegenerative disorders and longevity. Neurochem Res. 2001 Jun;26(6):739-64. Review. PMID: 11519733
51 Kanda K. Effects of food restriction on motoneuronal loss with advancing age in the rat. Microsc Res Tech. 2002 Nov 15;59(4):301-5. PMID: 12424792
52 Hori N, Hirotsu I, Davis PJ, Carpenter DO. Long-term potentiation is lost in aged rats but preserved by calorie restriction. Neuroreport. 1992 Dec;3(12):1085-8. PMID: 1337284
53 Contestabile A, Ciani E, Contestabile A. Dietary restriction differentially protects from neurodegeneration in animal models of excitotoxicity. Brain Res. 2004 Mar 26;1002(1-2):162-6. PMID: 14988047
54 Nilay V. Patel, Marcia N. Gordon, Karen E. Connor, Robert A. Good, Robert W. Engelman, Jerimiah Mason, David G. Morgan, Todd E. Morgan Caloric restriction attenuates Abeta-deposition in Alzheimer transgenic models. Neurobiology of Aging. Article in Press, Corrected Proof
55 Mattson MP. Will caloric restriction and folate protect against AD and PD? Neurology. 2003 Feb 25;60(4):690-5. PMID: 12601113
56 Means LW, Higgins JL, Fernandez TJ. Mid-life onset of dietary restriction extends life and prolongs cognitive functioning. Physiol Behav. 1993 Sep;54(3):503-8. PMID: 8415944
58 Wang J, Ho L, Qin W, Rocher AB, Seror I, Humala N, Maniar K, Dolios G, Wang R, Hof PR, Pasinetti GM. Caloric restriction attenuates beta-amyloid neuropathology in a mouse model of Alzheimer's disease. FASEB J. 2005 Jan 13; [Epub ahead of print] PMID: 15650008
59 Maswood N, Young J, Tilmont E, Zhang Z, Gash DM, Gerhardt GA, Grondin R, Roth GS, Mattison J, Lane MA, Carson RE, Cohen RM, Mouton PR, Quigley C, Mattson MP, Ingram DK. Caloric restriction increases neurotrophic factor levels and attenuates neurochemical and behavioral deficits in a primate model of Parkinson's disease. Proc Natl Acad Sci U S A. 2004 Dec 16; PMID: 15604149
60 Calorie restriction attenuates Alzheimer's disease type brain amyloidosis in Squirrel monkeys (Saimiri sciureus). J Alzheimers Dis. 2006 Dec;10(4):417-22. PMID: 17183154
61 Seidman MD. Effects of dietary restriction and antioxidants on presbyacusis. Laryngoscope. 2000 May;110(5 Pt 1):727-38. Review. PMID: 10807352
62 Torre P 3rd, Mattison JA, Fowler CG, Lane MA, Roth GS, Ingram DK. Assessment of auditory function in rhesus monkeys (Macaca mulatta): effects of age and calorie restriction. Neurobiol Aging. 2004 Aug;25(7):945-54. PMID: 15212848
63 Role of mitochondrial dysfunction and mitochondrial DNA mutations in age-related hearing loss. Hear Res. 2006 Jul 24; PMID: 16870370
64 Apte UM, Limaye PB, Desaiah D, Bucci TJ, Warbritton A, Mehendale HM. Mechanisms of increased liver tissue repair and survival in diet-restricted rats treated with equitoxic doses of thioacetamide. Toxicol Sci. 2003 Apr;72(2):272-82. PMID: 12655029
66 Li Y, Yan Q, Wolf NS. Long-term caloric restriction delays age-related decline in proliferation capacity of murine lens epithelial cells in vitro and in vivo. Invest Ophthalmol Vis Sci. 1997 Jan;38(1):100-7. PMID: 9008635
67 Zainal TA, Oberley TD, Allison DB, Szweda LI, Weindruch R. Caloric restriction of rhesus monkeys lowers oxidative damage in skeletal muscle. FASEB J. 2000 Sep;14(12):1825-36. PMID: 10973932 free full text at http://www.fasebj.org/cgi/content/full/14/12/1825
68 Lee CM, Aspnes LE, Chung SS, Weindruch R, Aiken JM. Influences of caloric restriction on age-associated skeletal muscle fiber characteristics and mitochondrial changes in rats and mice. Ann N Y Acad Sci. 1998 Nov 20;854:182-91. Review. PMID: 9928429
69 Payne AM, Dodd SL, Leeuwenburgh C. Life-long calorie restriction in Fischer-344 rats attenuates age related loss in skeletal muscle specific force and reduces extracellular space. J Appl Physiol. 2003 Sep 12 [Epub ahead of print] PMID: 12972444
70 McKiernan S, Bua E, McGorray J, Aiken J. Early-onset calorie restriction conserves fiber number in aging rat skeletal muscle. FASEB J. 2004 Jan 20 [Epub ahead of print] PMID: 14734642
71 Phillips T, Leeuwenburgh C. Muscle fiber-specific apoptosis and TNF-alpha signaling in sarcopenia are attenuated by life-long calorie restriction. FASEB J. 2005 Jan 21; [Epub ahead of print] PMID: 15665035
72 Usuki F, Yasutake A, Umehara F, Higuchi I. Beneficial effects of mild lifelong dietary restriction on skeletal muscle: prevention of age-related mitochondrial damage, morphological changes, and vulnerability to a chemical toxin. Acta Neuropathol (Berl). 2004 Jul;108(1):1-9. Epub 2004 Apr 17. PMID: 15095099
73 Effect of long-term caloric restriction and exercise on muscle bioenergetics and force development in rats. Am J Physiol. 1999 Apr;276(4 Pt 1):E766-73. PMID: 10198315
74 Capogrossi MC. Cardiac stem cells fail with aging: a new mechanism for the age-dependent decline in cardiac function. Circ Res. 2004 Mar 5;94(4):411-3. No abstract available. PMID: 15001538
75 Kawai SI, Vora S, Das S, Gachie E, Becker B, Neufeld AH. Modeling of risk factors for the degeneration of retinal ganglion cells after ischemia/reperfusion in rats: effects of age, caloric restriction, diabetes, pigmentation, and glaucoma. FASEB J. 2001 May;15(7):1285-7. PMID: 11344115. Free full text at http://www.fasebj.org/cgi/content/full/15/7/1285
76 Kim KY, Ju WK, Neufeld AH. Neuronal susceptibility to damage: comparison of the retinas of young, old and old/caloric restricted rats before and after transient ischemia. Neurobiol Aging. 2004 Apr;25(4):491-500. PMID: 15013570
77 Wang K, Li D, Sun F. Dietary caloric restriction may delay the development of cataract by attenuating the oxidative stress in the lenses of Brown Norway rats. Exp Eye Res. 2004 Jan;78(1):151-8. PMID: 14667836
78 Pahlavani MA. Influence of Caloric Restriction on Aging Immune System. J Nutr Health Aging. 2004;8(1):38-47. PMID: 14730366
79 http://www.eshow2000.com/geron/pdf/ProgramAbstracts_final.pdf
J.
Wu, J. Mattison, M. Ottinger, M. Zelinski-Wooten, A. Handy, G. Roth,
D. Ingram, E. Tilmont, M. Lane
OVARIAN
FUNCTION AND INCIDENCE OF ENDOMETRIOSIS IN MONKEYS ON LONG-TERM
CALORIE RESTRICTION Gerontologist. 2004 Oct; 44(1 Special):10.
80 Bhattacharyya TK, Merz M, Thomas JR. Modulation of cutaneous aging with calorie restriction in Fischer 344 rats: a histological study. Arch Facial Plast Surg. 2005 Jan-Feb;7(1):12-6. PMID: 15655168
81 Samaras TT, Elrick H. Height, body size and longevity. Acta Med Okayama. 1999 Aug;53(4):149-69. Review. PMID: 10488402
82 Samaras TT, Storms LH. Secular growth and its harmful ramifications. Med Hypotheses. 2002 Feb;58(2):93-112. Review. PMID: 11812183
83 Samaras TT, Storms LH. Impact of height and weight on life span. Bull World Health Organ. 1992;70(2):259-67. PMID: 1600586
84 Samaras TT, Elrick H. Less is better. J Natl Med Assoc. 2002 Feb;94(2):88-99. PMID: 11853051
85 Samaras TT, Elrick H, Storms LH. Height, health and growth hormone. Acta Paediatr. 1999 Jun;88(6):602-9. Review. PMID: 10419242
86 Samaras TT, Elrick H. Height, body size, and longevity: is smaller better for the human body? West J Med. 2002 May;176(3):206-8. No abstract available. PMID: 12016250 free full text
87 Samaras TT, Storms LH, Elrick H. Longevity, mortality and body weight. Ageing Res Rev. 2002 Sep;1(4):673-91. Review. PMID: 12208237
88 Holzenberger M, Martin-Crespo RM, Vicent D, Ruiz-Torres A. Decelerated growth and longevity in men. Arch Gerontol Geriatr. 1991 Jul-Aug;13(1):89-101. PMID: 15374439
89
Okamoto K, Sasaki R. [Geographical epidemiologic studies on
factors associated with centenarians in Japan]
Nippon Ronen
Igakkai Zasshi. 1995 Jul;32(7):485-90. Japanese.
PMID:
7500551
90 http://okinawaprogram.com/index.html
Cockerham WC, Yamori Y. Okinawa: an exception to the social gradient of life expectancy in Japan. Asia Pac J Clin Nutr. 2001;10(2):154-8. Review. PMID: 11710357
Sho H. History and characteristics of Okinawan longevity food. Asia Pac J Clin Nutr. 2001;10(2):159-64. PMID: 11710358
Suzuki M, Wilcox BJ, Wilcox CD. Implications from and for food cultures for cardiovascular disease: longevity. Asia Pac J Clin Nutr. 2001;10(2):165-71. Review. PMID: 11710359
91 Gruber RP, Kalamas AD. Measuring human age by estimating lifetime caloric consumption. Gerontology 2000 Jan-Feb;46(1):44-6; PMID: 11111228
92 McCarty MF. A low-fat, whole-food vegan diet, as well as other strategies that down-regulate IGF-I activity, may slow the human aging process. Med Hypotheses. 2003 Jun;60(6):784-92. PMID: 12699704
93 Willett W. Lessons from dietary studies in Adventists and questions for the future. Am J Clin Nutr. 2003 Sep;78(3 Suppl):539S-543S. Review. PMID: 12936947
94 Fraser GE, Shavlik DJ. Ten years of life: Is it a matter of choice? Arch Intern Med. 2001 Jul 9;161(13):1645-52. PMID: 11434797
95 Phelan JP, Rose MR. Why dietary restriction substantially increases longevity in animal models but won't in humans. Ageing Res Rev. 2005 Aug;4(3):339-50. PMID: 16046282 PDF
96 Manson JE, Willett WC, Stampfer MJ, Colditz GA, Hunter DJ, Hankinson SE, Hennekens CH, Speizer FE. Body weight and mortality among women. N Engl J Med. 1995 Sep 14;333(11):677-85. PMID: 7637744
97 McGee DL; Diverse Populations Collaboration. Body mass index and mortality: a meta-analysis based on person-level data from twenty-six observational studies. Ann Epidemiol. 2005 Feb;15(2):87-97. PMID: 15652713
98 Stevens J. Impact of age on associations between weight and mortality. Nutr Rev. 2000 May;58(5):129-37. Review. PMID: 10860392
99 Lindsted KD, Singh PN. Body mass and 26 y risk of mortality among men who never smoked: a re-analysis among men from the Adventist Mortality Study. Int J Obes Relat Metab Disord 1998 Jun;22(6):544-8; PMID: 9665675
100 Ajani UA, Lotufo PA, Gaziano JM, Lee IM, Spelsberg A, Buring JE, Willett WC, Manson JE. Body mass index and mortality among US male physicians. Ann Epidemiol. 2004 Nov;14(10):731-739. PMID: 15519894
101 Peeters A, Barendregt JJ, Willekens F, Mackenbach JP, Mamun AA, Bonneux L. Obesity in Adulthood and Its Consequences for Life Expectancy: A Life-Table Analysis. Ann Intern Med. 2003 Jan 7;138(1):24-32. PMID: 12513041
103 Midlife body mass index and hospitalization and mortality in older age. JAMA. 2006 Jan 11;295(2):190-8. PMID: 16403931
104 The relationship between overweight in adolescence and premature death in women. Ann Intern Med. 2006 Jul 18;145(2):91-7. PMID: 16847291
105 Midlife risk factors and healthy survival in men. JAMA. 2006 Nov 15;296(19):2343-50. PMID: 17105797
106 Gregg EW, Gerzoff RB, Thompson TJ, Williamson DF. Intentional weight loss and death in overweight and obese U.S. adults 35 years of age and older. Ann Intern Med. 2003 Mar 4;138(5):383-9. PMID: 12614090
107 Claudia H. Kawas, Maria M. Corrada, Irvine, CA, Annlia Paganini-Hill. Low Weight in Early Adulthood and Later Life Exercise Increase Chances of Surviving to Age 90. Presented at the 55th annual meeting of the American Academy of Neurology, held in Honolulu, Hawaii http://www.reuters.com/newsArticle.jhtml?type=healthNews&storyID=2510248
108 Das M, Gabriely I, Barzilai N. Caloric restriction, body fat and ageing in experimental models. Obes Rev. 2004 Feb;5(1):13-9. PMID: 14969503
109 Am J Clin Nutr 1997;66(4 Suppl.):1,044-50; PMID: 12146445
110 Greenberg J. Hypothesis - The J-shaped follow-up relation between mortality risk and disease risk-factor is due to statistical confounding. Med Hypotheses. 2002 Nov;59(5):568. PMID: 12376081
111 Manson JE, Stampfer MJ, Hennekens CH, Willett WC. Body weight and longevity. A reassessment. JAMA. 1987 Jan 16;257(3):353-8. PMID: 3795418
112 Lee IM, Manson JE, Hennekens CH, Paffenbarger RS Jr. Body weight and mortality. A 27-year follow-up of middle-aged men. JAMA. 1993 Dec 15;270(23):2823-8. PMID: 8133621
113 Ajani UA, Lotufo PA, Gaziano JM, Lee IM, Spelsberg A, Buring JE, Willett WC, Manson JE. Body mass index and mortality among US male physicians. Ann Epidemiol. 2004 Nov;14(10):731-739. PMID: 15519894
114 Int J Obes Relat Metab Disord 2001 Jul;25(7):1071-8; PMID: 11443509
115 Lindsted KD, Singh PN. Body mass and 26 y risk of mortality among men who never smoked: a re-analysis among men from the Adventist Mortality Study. Int J Obes Relat Metab Disord. 1998 Jun;22(6):544-8. PMID: 9665675
116 Singh PN, Lindsted KD, Fraser GE. Body weight and mortality among adults who never smoked. Am J Epidemiol. 1999 Dec 1;150(11):1152-64. PMID: 10588076
117 Korndorfer SR, Lucas AR, Suman VJ, Crowson CS, Krahn LE, Melton LJ 3rd. Long-term survival of patients with anorexia nervosa: a population-based study in Rochester, Minn. Mayo Clin Proc. 2003 Mar;78(3):278-84. PMID: 12630579
118 Greenberg JA. Biases in the mortality risk versus body mass index relationship in the NHANES-1 Epidemiologic Follow-Up Study. Int J Obes Relat Metab Disord. 2001 Jul;25(7):1071-8. PMID: 11443509
119 Manson JE, Willett WC, Stampfer MJ, Colditz GA, Hunter DJ, Hankinson SE, Hennekens CH, Speizer FE. Body weight and mortality among women. N Engl J Med. 1995 Sep 14;333(11):677-85. PMID: 7637744
120 Field AE, Coakley EH, Must A, Spadano JL, Laird N, Dietz WH, Rimm E, Colditz GA. Impact of overweight on the risk of developing common chronic diseases during a 10-year period. Arch Intern Med. 2001 Jul 9;161(13):1581-6. PMID: 11434789
121 http://cat.inist.fr/?aModele=afficheN&cpsidt=1101215
Relationship
between morbidity and body mass index of mariners in the Japan
Maritime Self-Defense Force Fleet Escort Force.
Mil Med. 2001
Aug;166(8):681-4. PMID: 11515316
122 Mattson MP. Existing data suggest that Alzheimer's disease is preventable. Ann N Y Acad Sci. 2000;924:153-9. Review. PMID: 11193791
123 Luchsinger JA, Tang MX, Shea S, Mayeux R. Caloric intake and the risk of Alzheimer disease. Arch Neurol. 2002 Aug;59(8):1258-63. PMID: 12164721
124 Grant WB. Dietary Links to Alzheimer’s Disease. Alzheimer’s Disease Review 2, 42-55, 1997 Free full text at http://www.mc.uky.edu/adreview/Vol2/Grant/grant.pdf; update at PMID: 12214118
125 Gustafson D, Rothenberg E, Blennow K, Steen B, Skoog I. An 18-year follow-up of overweight and risk of Alzheimer disease. Arch Intern Med. 2003 Jul 14;163(13):1524-8. PMID: 12860573
126 Obesity in middle age and future risk of dementia: a 27 year longitudinal population based study. BMJ. 2005 Jun 11;330(7504):1360. Epub 2005 Apr 29. PMID: 15863436; Free full text
127 Mattson MP. Gene-diet interactions in brain aging and neurodegenerative disorders. Ann Intern Med. 2003 Sep 2;139(5 Pt 2):441-4. PMID: 12965973
128 (not yet published, I think) http://msnbc.msn.com/id/5461382/
129 Gustafson D, Lissner L, Bengtsson C, Bjorkelund C, Skoog I. A 24-year follow-up of body mass index and cerebral atrophy. Neurology. 2004 Nov 23;63(10):1876-81. PMID: 15557505
130 Jood K, Jern C, Wilhelmsen L, Rosengren A. Body Mass Index in Mid-Life Is Associated With a First Stroke in Men. A Prospective Population Study Over 28 Years. Stroke. 2004 Oct 28; [Epub ahead of print] PMID: 15514172
131 Deschamps V, Astier X, Ferry M, Rainfray M, Emeriau JP, Barberger-Gateau P. Nutritional status of healthy elderly persons living in Dordogne, France, and relation with mortality and cognitive or functional decline. Eur J Clin Nutr. 2002 Apr;56(4):305-12. PMID: 11965506
132 Relation between body mass index and cognitive function in healthy middle-aged men and women. Neurology. 2006 Oct 10;67(7):1208-14. PMID: 17030754
133 Elias MF, Elias PK, Sullivan LM, Wolf PA, D'Agostino RB. Lower cognitive function in the presence of obesity and hypertension: the Framingham heart study. Int J Obes Relat Metab Disord. 2003 Feb;27(2):260-8. PMID: 12587008
134 Mattson MP, Duan W, Lee J, Guo Z. Suppression of brain aging and neurodegenerative disorders by dietary restriction and environmental enrichment: molecular mechanisms. Mech Ageing Dev. 2001 May 31;122(7):757-78. Review. PMID: 11322996
135 Ghadirian P, Jain M, Ducic S, Shatenstein B, Morisset R. Nutritional factors in the aetiology of multiple sclerosis: a case-control study in Montreal, Canada. Int J Epidemiol. 1998 Oct;27(5):845-52. PMID: 9839742
136 Abbott RD, Ross GW, White LR, Nelson JS, Masaki KH, Tanner CM, Curb JD, Blanchette PL, Popper JS, Petrovitch H. Midlife adiposity and the future risk of Parkinson's disease. Neurology. 2002 Oct 8;59(7):1051-7. PMID: 12370461
137 Song YM, Sung J, Davey Smith G, Ebrahim S. Body mass index and ischemic and hemorrhagic stroke: a prospective study in Korean men. Stroke. 2004 Apr;35(4):831-6. Epub 2004 Mar 04. PMID: 15001798
138 Li C, Engstrom G, Hedblad B, Berglund G, Janzon L. Risk factors for stroke in subjects with normal blood pressure: a prospective cohort study. Stroke. 2005 Feb;36(2):234-8. Epub 2004 Dec 23. PMID: 15618439
139 Influence of metabolic syndrome and general obesity on the risk of ischemic stroke. Stroke. 2006 Apr;37(4):1060-4. Epub 2006 Mar 2. PMID: 16514099
140 Patterson RE, Frank LL, Kristal AR, White E. A comprehensive examination of health conditions associated with obesity in older adults. Am J Prev Med. 2004 Dec;27(5):385-90. PMID: 15556738
141 Field AE, Coakley EH, Must A, Spadano JL, Laird N, Dietz WH, Rimm E, Colditz GA. Impact of overweight on the risk of developing common chronic diseases during a 10-year period. Arch Intern Med 2001 Jul 9;161(13):1581-6; PMID: 11434789
142 Hu FB, Manson JE, Stampfer MJ, Colditz G, Liu S, Solomon CG, Willett WC. Diet, lifestyle, and the risk of type 2 diabetes mellitus in women. N Engl J Med. 2001 Sep 13;345(11):790-7; PMID: 11556298
143 Wang Y, Rimm EB, Stampfer MJ, Willett WC, Hu FB. Comparison of abdominal adiposity and overall obesity in predicting risk of type 2 diabetes among men. Am J Clin Nutr. 2005 Mar;81(3):555-63. PMID: 15755822
144 Kouda K, Tanaka T, Kouda M, Takeuchi H, Takeuchi A, Nakamura H, Takigawa M. Low-energy diet in atopic dermatitis patients: clinical findings and DNA damage. J Physiol Anthropol Appl Human Sci. 2000 Sep;19(5):225-8. PMID: 11155351
146 Risk factors associated with age-related macular degeneration. A case-control study in the age-related eye disease study: age-related eye disease study report number 3. Age-Related Eye Disease Study Research Group. Ophthalmology. 2000 Dec;107(12):2224-32. PMID: 11097601
147 Weintraub JM, Willett WC, Rosner B, Colditz GA, Seddon JM, Hankinson SE. A prospective study of the relationship between body mass index and cataract extraction among US women and men. Int J Obes Relat Metab Disord. 2002 Dec;26(12):1588-95. PMID: 12461675
148 Jacques PF, Moeller SM, Hankinson SE, Chylack LT Jr, Rogers G, Tung W, Wolfe JK, Willett WC, Taylor A. Weight status, abdominal adiposity, diabetes, and early age-related lens opacities. Am J Clin Nutr. 2003 Sep;78(3):400-5. PMID: 12936921 free full text at http://www.ajcn.org/cgi/content/full/78/3/400
149 Nakano T, Tatemichi M, Miura Y, Sugita M, Kitahara K. Long-term physiologic changes of intraocular pressure: a 10-year longitudinal analysis in young and middle-aged Japanese men. Ophthalmology. 2005 Apr;112(4):609-16. PMID: 15808252
150 Masoro EJ, Iwasaki K, Gleiser CA, McMahan CA, Seo EJ, Yu BP. Dietary modulation of the progression of nephropathy in aging rats: an evaluation of the importance of protein. Am J Clin Nutr. 1989 Jun;49(6):1217-27. PMID: 2729159
151 Kristal AR, Cohen JH, Qu P, Stanford JL. Associations of energy, fat, calcium, and vitamin D with prostate cancer risk. Cancer Epidemiol Biomarkers Prev 2002 Aug;11(8):719-25; PMID: 12163324
152 Bianchini F, Kaaks R, Vainio H. Weight control and physical activity in cancer prevention. Obes Rev 2002 Feb;3(1):5-8; PMID: 12119660
154 Calle EE, Rodriguez C, Walker-Thurmond K, Thun MJ. Overweight, obesity, and mortality from cancer in a prospectively studied cohort of U.S. adults. N Engl J Med. 2003 Apr 24;348(17):1625-38. PMID: 12711737
155 Kuriyama S, Tsubono Y, Hozawa A, Shimazu T, Suzuki Y, Koizumi Y, Suzuki Y, Ohmori K, Nishino Y, Tsuji I. Obesity and risk of cancer in Japan. Int J Cancer. 2005 Jan 1;113(1):148-57. PMID: 15386435
156 Michels KB. The role of nutrition in cancer development and prevention. Int J Cancer. 2005 Mar 20;114(2):163-5. PMID: 15540221
158 Obesity, hypertension, and the risk of kidney cancer in men. N Engl J Med. 2000 Nov 2;343(18):1305-11. PMID: 11058675
159 Obesity, high energy intake, lack of physical activity, and the risk of kidney cancer. Cancer Epidemiol Biomarkers Prev. 2006 Dec;15(12):2453-60. PMID: 17164370
160 Neugut AI, Chen AC, Petrylak DP. The "Skinny" on Obesity and Prostate Cancer Prognosis. J Clin Oncol. 2003 Dec 22 [Epub ahead of print] No abstract available. PMID: 14691129
161 Body Mass Index, Weight Change, and Risk of Prostate Cancer in the Cancer Prevention Study II Nutrition Cohort. Cancer Epidemiol Biomarkers Prev. 2006 Dec 19; PMID: 17179486
162 A prospective investigation of height and prostate cancer risk. ancer Epidemiol Biomarkers Prev. 2006 Nov;15(11):2174-8. PMID: 17119043
163 Anthropometric Factors and Pancreatic Cancer in a Population-based Case-control Study in the San Francisco Bay Area. Cancer Causes Control. 2005 Dec;16(10):1235-44. PMID: 16215874
164 Michels KB, Ekbom A. Caloric restriction and incidence of breast cancer. JAMA. 2004 Mar 10;291(10):1226-30. PMID: 15010444
165 Tamakoshi K, Wakai K, Kojima M, Watanabe Y, Hayakawa N, Toyoshima H, Yatsuya H, Kondo T, Tokudome S, Hashimoto S, Suzuki K, Ito Y, Tamakoshi A. A prospective study of body size and colon cancer mortality in Japan: The JACC Study. Int J Obes Relat Metab Disord. 2004 Apr;28(4):551-8. PMID: 14968128
166 Moore LL, Bradlee ML, Singer MR, Splansky GL, Proctor MH, Ellison RC, Kreger BE. BMI and waist circumference as predictors of lifetime colon cancer risk in Framingham Study adults. Int J Obes Relat Metab Disord. 2004 Apr;28(4):559-67. PMID: 14770200
167 Calle EE, Thun MJ. Obesity and cancer. Oncogene. 2004 Aug 23;23(38):6365-78. PMID: 15322511
168 Jonsson F, Wolk A, Pedersen NL, Lichtenstein P, Terry P, Ahlbom A, Feychting M. Obesity and hormone-dependent tumors: Cohort and co-twin control studies based on the Swedish Twin Registry. Int J Cancer. 2003 Sep 10;106(4):594-9. PMID: 12845658
169 Mao Y, Pan S, Wen SW, Johnson KC. Physical inactivity, energy intake, obesity and the risk of rectal cancer in Canada. Int J Cancer. 2003 Jul 20;105(6):831-7. PMID: 12767070
170 Height and body mass index in relation to colorectal and gallbladder cancer in two million norwegian men and women. Cancer Causes Control. 2005 Oct;16(8):987-96. PMID: 16132807
171 Body size and risk of colon and rectal cancer in the European Prospective Investigation Into Cancer and Nutrition (EPIC). J Natl Cancer Inst. 2006 Jul 5;98(13):920-31. PMID: 16818856
172 Anthropometrics, physical activity, related medical conditions, and the risk of non-hodgkin lymphoma. Cancer Causes Control. 2005 Dec;16(10):1203-14. PMID: 16215871
173 Kurth T, Gaziano JM, Rexrode KM, Kase CS, Cook NR, Manson JE, Buring JE. Prospective study of body mass index and risk of stroke in apparently healthy women. Circulation. 2005 Apr 19;111(15):1992-8. PMID: 15837954
174 Gunnell DJ, Frankel SJ, Nanchahal K, Peters TJ, Davey Smith G. Childhood obesity and adult cardiovascular mortality: a 57-y follow-up study based on the Boyd Orr cohort. Am J Clin Nutr. 1998 Jun;67(6):1111-8. PMID: 9625081
175 Mora S, Yanek LR, Moy TF, Fallin MD, Becker LC, Becker DM. Interaction of body mass index and framingham risk score in predicting incident coronary disease in families. Circulation. 2005 Apr 19;111(15):1871-6. PMID: 15837938
176 Midlife body mass index and hospitalization and mortality in older age. JAMA. 2006 Jan 11;295(2):190-8. PMID: 16403931
178 Long-term caloric restriction ameliorates the decline in diastolic function in humans. J Am Coll Cardiol. 2006 Jan 17;47(2):398-402. PMID: 16412867
179 Cassidy AE, Bielak LF, Zhou Y, Sheedy PF 2nd, Turner ST, Breen JF, Araoz PA, Kullo IJ, Lin X, Peyser PA. Progression of subclinical coronary atherosclerosis: does obesity make a difference? Circulation. 2005 Apr 19;111(15):1877-82. PMID: 15837939
180 Tanko LB, Bagger YZ, Qin G, Alexandersen P, Larsen PJ, Christiansen C. Enlarged waist combined with elevated triglycerides is a strong predictor of accelerated atherogenesis and related cardiovascular mortality in postmenopausal women. Circulation. 2005 Apr 19;111(15):1883-90. PMID: 15837940
181 Christou DD, Gentile CL, DeSouza CA, Seals DR, Gates PE. Fatness is a better predictor of cardiovascular disease risk factor profile than aerobic fitness in healthy men. Circulation. 2005 Apr 19;111(15):1904-14. PMID: 15837943
182 Obesity and Risk of New-Onset Atrial Fibrillation After Cardiac Surgery. Circulation. 2005 Nov 14; [Epub ahead of print] PMID: 16286585
183 Body Mass Index and Coronary Heart Disease Risk Score: The Tromso Study, 1979 to 2001. Ann Epidemiol. 2006 Jul 29; PMID: 16882465
185 Value of the sagittal abdominal diameter in coronary heart disease risk assessment: cohort study in a large, multiethnic population. Am J Epidemiol. 2006 Dec 15;164(12):1150-9. Epub 2006 Oct 13. PMID: 17041127
186 Visser M, Langlois J, Guralnik JM, Cauley JA, Kronmal RA, Robbins J, Williamson JD, Harris TB. High body fatness, but not low fat-free mass, predicts disability in older men and women: the Cardiovascular Health Study. Am J Clin Nutr. 1998 Sep;68(3):584-90. PMID: 9734734
187 Ohmori K, Kuriyama S, Hozawa A, Ohkubo T, Tsubono Y, Tsuji I. Modifiable Factors for the Length of Life with Disability before Death: Mortality Retrospective Study in Japan. Gerontology. 2005 May-Jun;51(3):186-91. PMID: 15832046
188 Nystad W, Meyer HE, Nafstad P, Tverdal A, Engeland A. Body Mass Index in Relation to Adult Asthma among 135,000 Norwegian Men and Women. Am J Epidemiol. 2004 Nov 15;160(10):969-76. PMID: 15522853
189 Choi HK, Atkinson K, Karlson EW, Curhan G. Obesity, weight change, hypertension, diuretic use, and risk of gout in men: the health professionals follow-up study. Arch Intern Med. 2005 Apr 11;165(7):742-8. PMID: 15824292
190 From a CR list post: “…there's lots of info of CR on autoimmune disorders in rodents (reduces their development, slows their progression & pathology):
http://www.nutrition.org/cgi/content/full/130/7/1657
Including this human trial in atopic dermatitis:
... & several trials of fasting, &/or an energy-restricted (but also veg(etari)an) diet in human RA:
NB that many such studies are also gluten-free, which may play an important role in their efficacy:
191 Iwashige K, Kouda K, Kouda M, Horiuchi K, Takahashi M, Nagano A, Tanaka T, Takeuchi H. Calorie restricted diet and urinary pentosidine in patients with rheumatoid arthritis. J Physiol Anthropol Appl Human Sci. 2004 Jan;23(1):19-24. PMID: 14757997
192 Karlson EW, Mandl LA, Aweh GN, Sangha O, Liang MH, Grodstein F. Total hip replacement due to osteoarthritis: the importance of age, obesity, and other modifiable risk factors. Am J Med. 2003 Feb 1;114(2):93-8. PMID: 12586227
Gelber AC. Obesity and hip osteoarthritis: the weight of the evidence is increasing. Am J Med. 2003 Feb 1;114(2):158-9. No abstract available. PMID: 12586240
193 Guo Z, Mitchell-Raymundo F, Yang H, Ikeno Y, Nelson J, Diaz V, Richardson A, Reddick R. Dietary restriction reduces atherosclerosis and oxidative stress in the aorta of apolipoprotein E-deficient mice. Mech Ageing Dev 2002 Apr;123(8):1121-31; PMID: 12044962
194 Mehrotra C, Naimi TS, Serdula M, Bolen J, Pearson K. Arthritis, body mass index, and professional advice to lose weight; Implications for clinical medicine and public health. Am J Prev Med. 2004 Jul;27(1):16-21. PMID: 15212770
195 You, Tongjian; Nicklas, Barbara J. Inflammation and the Metabolic Syndrome: Role of Adipose Tissue and Modulation by Exercise. Medicine & Science in Sports & Exercise. 36(5), S1, May 2004.
196 Roberts RE, Deleger S, Strawbridge WJ, Kaplan GA. Prospective association between obesity and depression: evidence from the Alameda County Study. Int J Obes Relat Metab Disord. 2003 Apr;27(4):514-21. PMID: 12664085
197 Onyike CU, Crum RM, Lee HB, Lyketsos CG, Eaton WW. Is obesity associated with major depression? Results from the Third National Health and Nutrition Examination Survey. Am J Epidemiol. 2003 Dec 15; 158(12): 1139-47. PMID: 14652298
198 Body-mass index and symptoms of gastroesophageal reflux in women. N Engl J Med. 2006 Jun 1;354(22):2340-8. PMID: 16738270
199 Hu G, Barengo NC, Tuomilehto J, Lakka TA, Nissinen A, Jousilahti P. Relationship of Physical Activity and Body Mass Index to the Risk of Hypertension: A Prospective Study in Finland. Hypertension. 2004 Jan;43(1):25-30. Epub 2003 Dec 01. PMID: 14656958
200 Staessen J, Fagard R, Amery A. The relationship between body weight and blood pressure. J Hum Hypertens 1988 Dec;2(4):207-17; PMID: 3070038
201 Neter JE, Stam BE, Kok FJ, Grobbee DE, Geleijnse JM. Influence of weight reduction on blood pressure: a meta-analysis of randomized controlled trials. Hypertension. 2003 Nov;42(5):878-84. Epub 2003 Sep 15. PMID: 12975389
202 Wildman RP, Farhat GN, Patel AS, Mackey RH, Brockwell S, Thompson T, Sutton-Tyrrell K. Weight change is associated with change in arterial stiffness among healthy young adults. Hypertension. 2005 Feb;45(2):187-92. Epub 2004 Dec 13. PMID: 15596570
203 Aucott L, Poobalan A, Smith WC, Avenell A, Jung R, Broom J. Effects of weight loss in overweight/obese individuals and long-term hypertension outcomes: a systematic review. Hypertension. 2005 Jun;45(6):1035-41. Epub 2005 May 16. PMID: 15897373
204 Droyvold WB, Midthjell K, Nilsen TI, Holmen J. Change in body mass index and its impact on blood pressure: a prospective population study. Int J Obes Relat Metab Disord. 2005 Jun;29(6):650-5. PMID: 15809666
205 Engeland A, Bjorge T, Tverdal A, Sogaard AJ. Obesity in adolescence and adulthood and the risk of adult mortality. Epidemiology. 2004 Jan; 15(1): 79-85. PMID: 14712150
206 The risk of preeclampsia rises with increasing prepregnancy body mass index. Ann Epidemiol. 2005 Aug;15(7):475-82. PMID: 16029839
207 Weindruch R. Caloric restriction, gene expression, and aging. Alzheimer Dis Assoc Disord. 2003 Apr-Jun;17(2 Suppl):S58-9. No abstract available. PMID: 12813211
208 Hsieh LJ, Carter HB, Landis PK, Tucker KL, Metter EJ, Newschaffer CJ, Platz EA. Association of energy intake with prostate cancer in a long-term aging study: Baltimore Longitudinal Study of Aging (United States). Urology. 2003 Feb;61(2):297-301. PMID: 12597934
209 Suzuki S, Platz EA, Kawachi I, Willett WC, Giovannucci E. Intakes of energy and macronutrients and the risk of benign prostatic hyperplasia. Am J Clin Nutr. 2002 Apr;75(4):689-97. PMID: 11916755 free full text
210 Hammarsten J, Hogstedt B, Holthuis N, Mellstrom D. Components of the metabolic syndrome-risk factors for the development of benign prostatic hyperplasia. Prostate Cancer Prostatic Dis. 1998 Mar;1(3):157-162. PMID: 124969
211 Satia-Abouta J, Galanko JA, Potter JD, Ammerman A, Martin CF, Sandler RS; North Carolina Colon Cancer Study. Associations of total energy and macronutrients with colon cancer risk in African Americans and Whites: results from the North Carolina colon cancer study. Am J Epidemiol. 2003 Nov 15;158(10):951-62. PMID: 14607803
212 Frankel S, Gunnell DJ, Peters TJ, Maynard M, Davey Smith G. Childhood energy intake and adult mortality from cancer: the Boyd Orr Cohort Study. BMJ. 1998 Feb 14;316(7130):499-504. PMID: 9501710
213 Roth GS, Lane MA, Ingram DK, Mattison JA, Elahi D, Tobin JD, Muller D, Metter EJ. Biomarkers of caloric restriction may predict longevity in humans. Science. 2002 Aug 2;297(5582):811. PMID: 12161648
214 Staessen J, Fagard R, Lijnen P, Amery A. Body weight, sodium intake and blood pressure. J Hypertens Suppl. 1989 Feb;7(1):S19-23. Review. PMID: 2651610
215 Jan A Staessen, Jiguang Wang, Giuseppe Bianchi, Willem H Birkenhager. Seminar: Essential hypertension Lancet 361, Number 9369, 10 May 2003, page 1629
217 The influence of age on the effects of lifestyle modification and metformin in prevention of diabetes. J Gerontol A Biol Sci Med Sci. 2006 Oct;61(10):1075-81. PMID: 17077202
218 Edwards IJ, Rudel LL, Terry JG, Kemnitz JW, Weindruch R, Zaccaro DJ, Cefalu WT. Caloric restriction lowers plasma lipoprotein (a) in male but not female rhesus monkeys. Exp Gerontol 2001 Aug;36(8):1413-8; PMID: 11602214
219 Effect of 6-month calorie restriction on biomarkers of longevity, metabolic adaptation, and oxidative stress in overweight individuals: a randomized controlled trial. JAMA. 2006 Apr 5;295(13):1539-48. PMID: 16595757
220 Walford RL, Harris SB, Gunion MW. The calorically restricted low-fat nutrient-dense diet in Biosphere 2 significantly lowers blood glucose, total leukocyte count, cholesterol, and blood pressure in humans. Proc Natl Acad Sci U S A. 1992 Dec 1;89(23):11533-7. PMID: 1454844
Walford RL, Mock D, Verdery R, MacCallum T. Calorie restriction in biosphere 2: alterations in physiologic, hematologic, hormonal, and biochemical parameters in humans restricted for a 2-year period. J Gerontol A Biol Sci Med Sci. 2002 Jun;57(6):B211-24. PMID: 12023257
221 Brown DW, Ford ES, Giles WH, Croft JB, Balluz LS, Mokdad AH. Associations between white blood cell count and risk for cerebrovascular disease mortality: NHANES II Mortality Study, 1976-1992. Ann Epidemiol. 2004 Jul;14(6):425-30. PMID: 15246331
222 Ridker PM, Rifai N, Rose L, Buring JE, Cook NR. Comparison of C-Reactive Protein and Low-Density Lipoprotein Cholesterol Levels in the Prediction of First Cardiovascular Events. N Engl J Med. 2002 Nov 14;347(20):1557-1565. PMID: 12432042
223 Tchernof A, Nolan A, Sites CK, Ades PA, Poehlman ET. Weight loss reduces C-reactive protein levels in obese postmenopausal women. Circulation 2002 Feb 5;105(5):564-9; PMID: 11827920
224 Circulating oxidized LDL is associated with increased waist circumference independent of body mass index in men and women. Am J Clin Nutr. 2006 Jan;83(1):30-5. PMID: 16400046
225 Fontana L, Meyer TE, Klein S, Holloszy JO. Long-term calorie restriction is highly effective in reducing the risk for atherosclerosis in humans. Proc Natl Acad Sci U S A. 2004 Apr 19 PMID: 15096581
226 Janssen I, Katzmarzyk PT, Ross R. Duration of overweight and metabolic health risk in American men and women. Ann Epidemiol. 2004 Sep;14(8):585-91. PMID: 15350959
227 Gawande AA, Studdert DM, Orav EJ, Brennan TA, Zinner MJ. Risk factors for retained instruments and sponges after surgery. N Engl J Med. 2003 Jan 16;348(3):229-35. PMID: 12529464
228 Mock CN, Grossman DC, Kaufman RP, Mack CD, Rivara FP. The relationship between body weight and risk of death and serious injury in motor vehicle crashes. Accid Anal Prev. 2002 Mar;34(2):221-8. PMID: 11829292
229 Angela L. Neville; Carlos V. R. Brown; Janie Weng; Demetrios Demetriades; George C. Velmahos Obesity Is an Independent Risk Factor of Mortality in Severely Injured Blunt Trauma Patients Arch Surg. 2004;139:983-987.
231 Santos MS, Lichtenstein AH, Leka LS, Goldin B, Schaefer EJ, Meydani SN. Immunological Effects of Low-Fat Diets with and without Weight Loss. J Am Coll Nutr. 2003 Apr;22(2):174-182. PMID: 12672714
232 Hu FB, Willett WC, Li T, Stampfer MJ, Colditz GA, Manson JE. Adiposity as compared with physical activity in predicting mortality among women. N Engl J Med. 2004 Dec 23;351(26):2694-703. PMID: 15616204
233 Heilbronn LK, Ravussin E. Calorie restriction and aging: review of the literature and implications for studies in humans. Am J Clin Nutr. 2003 Sep;78(3):361-9. Review. PMID: 12936916
234 Poehlman ET, Turturro A, Bodkin N, Cefalu W, Heymsfield S, Holloszy J, Kemnitz J. Caloric restriction mimetics: physical activity and body composition changes. J Gerontol A Biol Sci Med Sci. 2001 Mar;56 Spec No 1:45-54. Review. PMID: 12088211 Free full text http://biomed.gerontologyjournals.org/cgi/content/full/56/suppl_1/45
235 Masoro EJ. Subfield history: caloric restriction, slowing aging, and extending life.Sci Aging Knowl Environ. 2003 Feb 26;2003(8):RE2. PMID: 12844547
237 Caloric Restriction: A Key to Understanding and Modulating Aging. E.J. Masoro. Elsevier, 2002. ISBN: 0444511628
238 Walford’s extensive books on CR can be found at http://www.walford.com/books.htm
239
http://www.ultrahiq.net/Ubiquity/Winter02/CR.html
http://o112.ryd.student.liu.se/calorie_restriction/
241 http://www.the-scientist.com/yr1997/may/research_970526.html
http://whyfiles.org/057aging/lo_cal.html
http://www.sciencedaily.com/releases/2001/01/010123075904.htm
http://www.sciencenews.org/20001125/fob3.asp
http://www.liv.ac.uk/~adelam/biolage.htm
http://www.healthy.net/asp/templates/article.asp?PageType=Article&ID=221
http://www.lougehrigsdisease.net/als_news/990112caloric_restriction_reduces_risk.htm
http://www.infoaging.org/b-cal-6role.html
http://clos.net/calorie_restriction_refs.htm
http://www.washingtonpost.com/wp-dyn/articles/A6432-2001Jul16.html
http://www.sciam.com/specialissues/0600aging/0600taubes.html
http://www.stn2.com/articles/view.php3?language=english&type=article&article_id=218391731
248 Rolls BJ, Morris EL, Roe LS. Portion size of food affects energy intake in normal-weight and overweight men and women. Am J Clin Nutr. 2002 Dec;76(6):1207-13. PMID: 12450884
249 Bad popcorn in big buckets: portion size can influence intake as much as taste. J Nutr Educ Behav. 2005 Sep-Oct;37(5):242-5. PMID: 16053812
251 Orlet Fisher J, Rolls BJ, Birch LL. Children's bite size and intake of an entree are greater with large portions than with age-appropriate or self-selected portions. Am J Clin Nutr. 2003 May;77(5):1164-70. PMID: 12716667
252 Kral TV, Roe LS, Rolls BJ. Combined effects of energy density and portion size on energy intake in women. Am J Clin Nutr. 2004 Jun;79(6):962-968. PMID: 15159224
253 Hensrud DD. Diet and obesity. Curr Opin Gastroenterol. 2004 Mar;20(2):119-24. PMID: 15703632
254 Reductions in portion size and energy density of foods are additive and lead to sustained decreases in energy intake. Am J Clin Nutr. 2006 Jan;83(1):11-7. PMID: 16400043
255 Ice cream illusions bowls, spoons, and self-served portion sizes. Am J Prev Med. 2006 Sep;31(3):240-3. PMID: 16905035
256 Marmonier C, Chapelot D, Fantino M, Louis-Sylvestre J. Snacks consumed in a nonhungry state have poor satiating efficiency: influence of snack composition on substrate utilization and hunger. Am J Clin Nutr. 2002 Sep;76(3):518-28. PMID: 12197994
257 Hagan MM, Chandler PC, Wauford PK, Rybak RJ, Oswald KD. The role of palatable food and hunger as trigger factors in an animal model of stress induced binge eating. Int J Eat Disord. 2003 Sep;34(2):183-97. PMID: 12898554
259 De Castro JM. The time of day of food intake influences overall intake in humans. J Nutr. 2004 Jan;134(1):104-11. PMID: 14704301
260 Farshchi HR, Taylor MA, Macdonald IA. Deleterious effects of omitting breakfast on insulin sensitivity and fasting lipid profiles in healthy lean women. Am J Clin Nutr. 2005 Feb;81(2):388-96. PMID: 15699226
261 A high-protein diet induces sustained reductions in appetite, ad libitum caloric intake, and body weight despite compensatory changes in diurnal plasma leptin and ghrelin concentrations. Am J Clin Nutr. 2005 Jul;82(1):41-8. PMID: 16002798
262 Klem ML, Wing RR, Lang W, McGuire MT, Hill JO. Does weight loss maintenance become easier over time? Obes Res. 2000 Sep;8(6):438-44. PMID: 11011910
263 Quaade F, Vrist E, Astrup A. [Dietary fiber added to a very-low caloric diet reduces hunger and alleviates constipation] Ugeskr Laeger. 1990 Jan 8;152(2):95-8. Danish. PMID: 2154070
265 Zemel MB. Regulation of adiposity and obesity risk by dietary calcium: mechanisms and implications. J Am Coll Nutr. 2002 Apr;21(2):146S-151S. Review. PMID: 11999543
266 The impact of calcium and dairy product consumption on weight loss. Obes Res. 2005 Oct;13(10):1720-6. PMID: 16286519
267 Glycemic index and glycemic load in relation to changes in body weight, body fat distribution, and body composition in adult Danes. Am J Clin Nutr. 2006 Oct;84(4):871-9. PMID: 17023715
270 Aude YW, Agatston AS, Lopez-Jimenez F, Lieberman EH, Marie Almon, Hansen M, Rojas G, Lamas GA, Hennekens CH. The national cholesterol education program diet vs a diet lower in carbohydrates and higher in protein and monounsaturated fat: a randomized trial. Arch Intern Med. 2004 Oct 25;164(19):2141-6. PMID: 15505128
271 Pereira MA, Swain J, Goldfine AB, Rifai N, Ludwig DS. Effects of a low-glycemic load diet on resting energy expenditure and heart disease risk factors during weight loss. JAMA. 2004 Nov 24;292(20):2482-90. PMID: 15562127
274 Eriksson J, Forsen T, Osmond C, Barker D. Obesity from cradle to grave. Int J Obes Relat Metab Disord. 2003 Jun;27(6):722-7. PMID: 12833117
275 Consequences of a long-term raw food diet on body weight and menstruation: results of a questionnaire survey. Ann Nutr Metab. 1999;43(2):69-79. PMID: 10436305
276 The effects of a low-fat, plant-based dietary intervention on body weight, metabolism, and insulin sensitivity. Am J Med. 2005 Sep;118(9):991-7. PMID: 16164885
277 Sorensen LB, Moller P, Flint A, Martens M, Raben A. Effect of sensory perception of foods on appetite and food intake: a review of studies on humans. Int J Obes Relat Metab Disord. 2003 Oct;27(10):1152-66. Review. PMID: 14513063
279 A self-regulation program for maintenance of weight loss. N Engl J Med. 2006 Oct 12;355(15):1563-71. PMID: 17035649
280 The impact of manipulating personal standards on eating attitudes and behaviour. Behav Res Ther. 2005 Oct 27; [Epub ahead of print] PMID: 16257388
281 Hagan MM, Wauford PK, Chandler PC, Jarrett LA, Rybak RJ, Blackburn K. A new animal model of binge eating: key synergistic role of past caloric restriction and stress. Physiol Behav. 2002 Sep;77(1):45-54. PMID: 12213501
283 “How to Live 100 Years, or Discourses on the Sober Life” Being the Personal Narrative of Luigi Cornaro (1464-1566 a.d.) http://www.soilandhealth.org/02/0201hyglibcat/020105cornaro.html
293 Rikke BA, Yerg JE, Battaglia ME, Nagy TR, Allison DB, Johnson TE. Strain variation in the response of body temperature to dietary restriction. Mech Ageing Dev. 2003 May;124(5):663-78. PMID: 12735906
294 Dannenberg AL, Burton DC, Jackson RJ. Economic and environmental costs of obesity: the impact on airlines. Am J Prev Med. 2004 Oct;27(3):264. No abstract available. PMID: 15450642
295 The Economic Impact of Obesity on Automobile Fuel Consumption, The Engineering Economist Oct-Dec 2006
296 Raebel MA, Malone DC, Conner DA, Xu S, Porter JA, Lanty FA. Health services use and health care costs of obese and nonobese individuals. Arch Intern Med. 2004 Oct 25;164(19):2135-40. PMID: 15505127
297 http://www.cdc.gov/nccdphp/dnpa/obesity-epidemic.htm
Flegal KM, Carroll MD, Ogden CL, Johnson CL. Prevalence and trends in obesity among US adults, 1999-2000. JAMA. 2002 Oct 9;288(14):1723-7. PMID: 12365955
Ogden CL, Flegal KM, Carroll MD, Johnson CL. Prevalence and trends in overweight among US children and adolescents, 1999-2000. JAMA. 2002 Oct 9;288(14):1728-32. PMID: 12365956
298 Trifunovic A, Wredenberg A, Falkenberg M, Spelbrink JN, Rovio AT, Bruder CE, Bohlooly-Y M, Gidlof S, Oldfors A, Wibom R, Tornell J, Jacobs HT, Larsson NG. Premature ageing in mice expressing defective mitochondrial DNA polymerase. Nature. 2004 May 27;429(6990):417-23. PMID: 15164064
299 Barja G. Aging in vertebrates, and the effect of caloric restriction: a mitochondrial free radical production-DNA damage mechanism? Biol Rev Camb Philos Soc. 2004 May;79(2):235-51. PMID: 15191224
300 Julian D, Leeuwenburgh C. Linkage between insulin and the free radical theory of aging. Am J Physiol Regul Integr Comp Physiol. 2004 Jan;286(1):R20-1. Review. No abstract available. PMID: 14660473
301 Lambert AJ, Wang B, Merry BJ. Exogenous insulin can reverse the effects of caloric restriction on mitochondria. Biochem Biophys Res Commun. 2004 Apr 16;316(4):1196-201. PMID: 15044112
302
Bartosz G. Food toxicity
contributes to the beneficial effects of calorie restriction •
CORRESPONDENCE
Journal of Theoretical Biology, Available
online 8 December 2004
303 Weindruch R, Walford RL, Fligiel S, Guthrie D. The retardation of aging in mice by dietary restriction: longevity, cancer, immunity and lifetime energy intake. J Nutr. 1986 Apr;116(4):641-54. PMID: 3958810
305 Hebebrand J, Himmelmann GW, Herzog W, Herpertz-Dahlmann BM, Steinhausen HC, Amstein M, Seidel R, Deter HC, Remschmidt H, Schafer H. Prediction of low body weight at long-term follow-up in acute anorexia nervosa by low body weight at referral. Am J Psychiatry. 1997 Apr;154(4):566-9. PMID: 9090350
308 Field AE, Coakley EH, Must A, Spadano JL, Laird N, Dietz WH, Rimm E, Colditz GA. Impact of overweight on the risk of developing common chronic diseases during a 10-year period. Arch Intern Med. 2001 Jul 9;161(13):1581-6. PMID: 11434789
309 Sawada M, Enesco HE. A study of dietary restriction and lifespan in the rotifer Asplanchna brightwelli monitored by chronic neutral red exposure. Exp Gerontol. 1984;19(5):329-34. PMID: 6510477
310 Austad SN. Life extension by dietary restriction in the bowl and doily spider, Frontinella pyramitela. Exp Gerontol. 1989;24(1):83-92. PMID: 2707314
311 http://www.theadvocate.com/stories/072102/sci_lifespan001.shtml Sources: S.N. Austad, "Life extension by dietary restriction in the bowl and doily spider," Experimental Gerontology, 1988; C.H. Barrows and Gertrude C. Kokkonen, "Dietary restriction and life extension," in Nutritional Approaches to Aging Research, 1982; http://www.vetshow.com/download/purina/kealy.pdf
313 From the December 1997 issue of the Nutrition Action Healthletter, published by CSPI (Center for Science in the Public Interest). Their sources:
Arthritis: Annals of Internal Medicine 109: 18, 1988;
Diabetes: Ann Intern Med 1995 Apr 1;122(7):481-6; PMID: 7872581;
Endometrial cancer: Cancer Epidemiol Biomarkers Prev 1993 Jul-Aug;2(4):321-7; PMID: 8348055;
Gallstones: Obstetrics and Gynecology 84: 207, 1994;
Hypertension: Hypertension 1996 May;27(5):1065-72; PMID: 8621198.
314 Merry BJ. Molecular mechanisms linking calorie restriction and longevity. Int J Biochem Cell Biol. 2002 Nov;34(11):1340-54. Review. PMID: 12200030
http://athena.molbiol.saitama-u.ac.jp/~molbiol/Lec/Metabolism/CalRestr.htm
316 Tovee MJ, Reinhardt S, Emery JL, Cornelissen PL. Optimum body-mass index and maximum sexual attractiveness. Lancet. 1998 Aug 15;352(9127):548. No abstract available. PMID: 9716069